Download
1 / 38
420 likes | 782 Views
Physical factors in the generation of runoff. Learning objectives Be able to describe the processes involved in runoff generation

E N D
Physical factors in the generation of runoff Learning objectives • Be able to describe the processes involved in runoff generation • Be able to distinguish between infiltration excess, saturation excess and subsurface stormflow runoff generation mechanisms and identify when and where each is more likely to occur • Be able to describe the physical factors resulting in the occurrence of runoff by the different mechanisms
Resources • Rainfall Runoff Module Online, http://hydrology.usu.edu/RRP, Chapters 1 - 3 • Dingman Chapters 6, 9 • Jeff McDonnell Website (http://www.cof.orst.edu/cof/fe/watershd/) • Benchmark papers in streamflowgeneration processes (many at http://www.cof.orst.edu/cof/fe/watershd/fe537/bpapers.html)
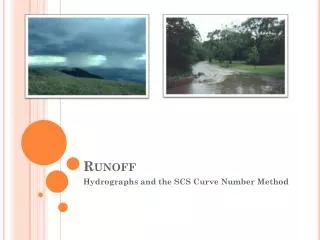
Rainfall Runoff Processes Physical Processes involved in Runoff Generation
Pathways followed by subsurface runoff on hillslopes (from Kirkby, 1978)
Threshold Hillslope Response Relationship between runoff ratio and soil moisture content. (Woods et al., 2001.)
Relation between runoff and depth to groundwater (b) 103 m from stream (a) 14 m from stream, Two different locations in the Svartberget catchment (Seibert et al., 2003)
Infiltration follows preferential pathways (a) Photograph of cross section through soil following dye tracing experiment. (b) Moisture content inferred from dye tracing experiment. (Courtesy of Markus Weiler)
Wetting may occur at depth before at the surface See preferential pathway infiltration animation http://hydrology.neng.usu.edu/RRP/ (ch 2)
P (a) Infiltration excess overland flow (also called Horton overland flow) f P qo P f Runoff Generation Mechanisms (following Beven, 2001) See infiltration excess runoff generation animation http://hydrology.neng.usu.edu/RRP/ (ch 2)
f0 f1 Figure 7. Rainfall, runoff, infiltration and surface storage during a natural rainstorm. The shaded areas under the rainfall graph represent precipitation falling at a rate exceeding the infiltration rate. The dark grey area represents rainfall that enters depression storage, which is filled before runoff occurs. The light grey shading represents rainfall that becomes overland flow. The initial infiltration rate is f0, and f1 is the final constant rate of infiltration approached in large storms. (from Dunne and Leopold, 1978)
Overland flow moves downslope as an irregular sheet (from Dunne and Leopold, 1978)
(b) Partial area infiltration excess overland flow P Fraction of area contributing to overland flow qo P P f (following Beven, 2001)
(c) Saturation excess overland flow P Variable source area P P qo qr qs (following Beven, 2001) See saturation excess runoff generation animation http://hydrology.neng.usu.edu/RRP/ (ch 2)
(d) Subsurface stormflow P P P qs (following Beven, 2001) See subsurface runoff generation animation http://hydrology.neng.usu.edu/RRP/ (ch 2)
(e) Perched subsurface stormflow P Horizon 1 Horizon 2 P P qs Impeding layer (following Beven, 2001) See perched layer stormflow runoff generation animation http://hydrology.neng.usu.edu/RRP/ (ch 2)
Map of saturated areas showing expansion during a single rainstorm. The solid black shows the saturated area at the beginning of the rain; the lightly shaded area is saturated by the end of the storm and is the area over which the water table had risen to the ground surface. (from Dunne and Leopold, 1978)
Seasonal variation in pre-storm saturated area (from Dunne and Leopold, 1978)
Variable Source Area Concept (from Chow et al, 1988). The small arrows in the hydrographs show how the streamflow increases as the variable source extends into swamps, shallow soils and ephemeral channels. The process reverses as streamflow declines.
Transmissivity Feedback Schematic illustration of macropore network being activated due to rise in groundwater resulting in rapid lateral flow.
Soil Low permeable bedrock Rapid lateral flow at soil bedrock interface.
Features of subsurface stormflow • Unimpeded entry by new water from rainfall into the soil • Rapid downslope flow through preferential paths • Mixing with old water depending on rainfall intensity and soil moisture status From Brutsaert, 2005, p454
(a) Rain Rain Rain Water table Baseflow 0 s 0 s (b) Water table Baseflow + subsurface stormflow 0 s 0 s (c) Direct precipitation on saturated zone Water table Return flow Baseflow + subsurface stormflow 0 s 0 s Groundwater ridging subsurface stormflow processes in an area of high infiltration rate.
The particular runoff process that dominates is place and time dependent
Surface Water Input Evapotranspiration Hortonian OF Infiltration capacity Saturation OF Saturation Variable source area Infiltration Return flow Soil regolith Regolith subsurface flow (interflow) Percolation Deeper groundwater aquifer Aquifer subsurface flow (baseflow)
Summary points • A bewildering range of hydrologic, climatic, topographic and soil conditions which favor different mechanisms • Extreme complexity suggests a single unifying model may not be possible or desirable • Distributed models allow exploration of consequences of simplifying assumptions and can lead to better understanding of the interplay between processes and pathways • Mathematical rigor may instill false confidence and undeserved sense of realism • Catchment scale parameterizations have difficulty representing spatial variability From Brutsaert, 2005, p457-461
Water Balance Equation P E P=Q+E Q=P-E ∆S=P-Q-E ∆S Q
E=P Q E=Ep E P=Q+E E P
E=P E=Ep W=Q/P 1 W=Q/P 0 P=Q+E E Q E P
ID PA IA OH VA MO AZ OK GA MS TX FL 100 Reynolds Ck, ID Coshocton, OH 10 Mean annual Runoff (inches) Reisel, TX San Pedro, AZ 1 Walnut Gulch, AZ 0.1 0.1 10 1000 0.001 Area (sq. miles) Scale dependence of mean annual runoff for different geographic locations in the U.S. (Courtesy of David Goodrich, USDA-ARS).
Flood wave advancing over a dry stream bed in Walnut Gulch experimental watershed where channel transmission losses are considerable. (Courtesy of David Goodrich, USDA-ARS)
Thin soils; gentle concave footslopes; wide valley bottoms; soils of high to low permeability Direct precipitation and return flow dominate hydrograph; subsurface stormflow less important Horton overland flow dominates hydrograph; contributions from subsurface stormflow are less important Variable source concept Subsurface stormflow dominates hydrograph volumetrically; peaks produced by return flow and direct precipitation Topography and soils Steep, straight hillslopes; deep,very permeable soils; narrow valley bottoms Arid to sub-humid climate; thin vegetation or disturbed by humans Humid climate; dense vegetation Climate, vegetation and land use Runoff processes in relation to their major controls. (From Dunne and Leopold, 1978)
Topographic definition of contributing area, concentrated at a point or dispersed (specific catchment area) on a hillslope.
Saturation occurs when Definition of the upslope area draining through a point within a catchment q = a r S qcap = T S
ln(a/S) wetness index for a small watershed evaluated from a 30 m Digital Elevation Model.
Saturated area based on wetness index for two different T/r thresholds.