Download
1 / 37

E N D
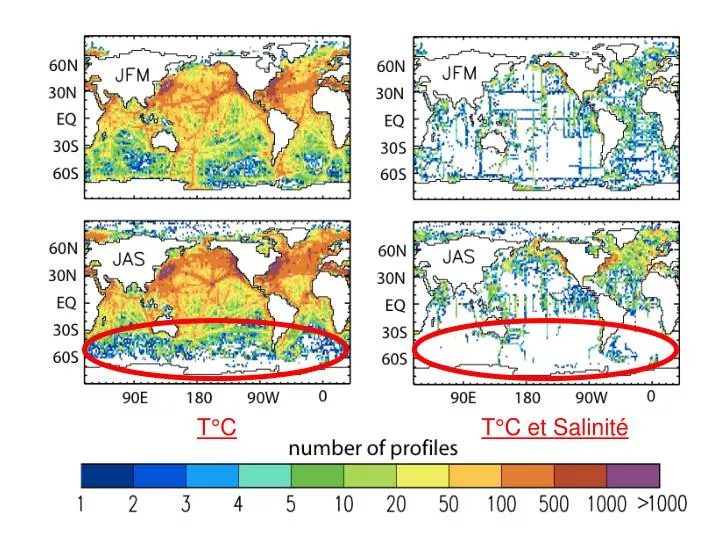
T°C T°C et Salinité
Figure 5.7 Upper: Zonal averages of heat transfer to the ocean by insolation QSW, and loss by longwave radiation QLW, sensible heat flux QS, and latent heat flux QL, calculated by DaSilva, Young, and Levitus (1995) using the COADS data set. Lower: Net heat flux through the sea surface calculated from the data above (solid line) and net heat flux constrained to give heat and fresh-water transports by the ocean that match independent calculations of these trasports. The area under the lower curves ought to be zero, but it is 16W/m2 for the unconstrained case and -3W/m2 for the constrained case.
Figure 5.8 Global map of annual-mean insolation into the sea QSW in W/m2 calculated from the ECMWF 40-year reanalysis. From Kallberg et al 2005.
Figure 5.13 Meridional transport of fresh water by the Atlantic from three surface-flux calculations: BR-Baumgartner and Reichel (1975); SBD-Schmitt et al., (1989); and IH-Isemer and Hasse's (1987) evaporation estimates combined with Dorman and Bourke's (1981) precipitation values. Also shown are direct measurements at 24° N by Hall and Bryden (1982) and 11° N by Friedrichs and Hall (1993). All are summed relative to an estimated Arctic southward export due to the Bering Strait through flow and the water budget of the Arctic itself. From Schmitt (1994).
Température, salinité, densité Ici p=Pa
Formation et destruction des masses d’eau: Subduction, circulation/diffusion, obduction
Mer d’Arabie Pacifique Nord subtropical Pacifique Nord subpolaire
Géostrophie en profondeur En profondeur u=~0
Subduction/obduction par calcul de We (simulation du modèle d’océan de l’IPSL forcé par NCEPutisée pour toutes les figures suivantes, sauf lorsque mentionné) Subduction-obduction (1983) : obduction équatoriale et zone de subduction majeure Fonction de courant (B) de la circulation dans la thermocline sur l’isopycne s25
Age (years) of Pacific Ocean waters on the isopycnal surface 27.2 sq, using the ratio of chlorofluorocarbon-11 to chlorofluorocarbon-12, from Fine et al. (2001)