Download
1 / 17
180 likes | 292 Views
Statistical Significance Testing. Why do it? When to do it? How to it?. Testing is Important. Red shading is not statistically significant. Statements you might want to make. Estimate X is bigger than Y Estimate X this year is larger than X last year

E N D
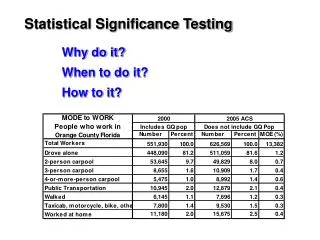
Statistical Significance Testing Why do it? When to do it? How to it?
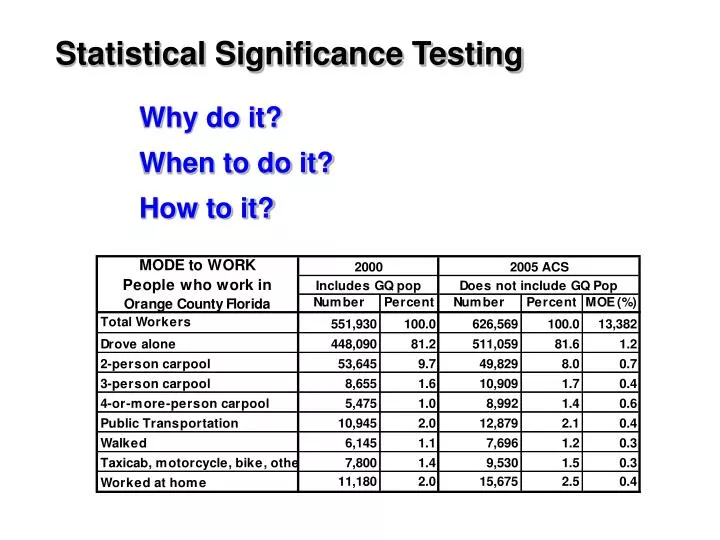
Testing is Important Red shading is not statistically significant
Statements you might want to make • Estimate X is bigger than Y • Estimate X this year is larger than X last year • Estimate X is smaller than Census 2000 value • State A has the highest Value
Comparing SF3 or CTPP 2000 to current ACS Let’s do a test
1.Get the Margin of Error (MOE) from ACS 2. Calculate the Standard Error (SE) [SE = MOE / 1.645] 3. Solve for Z where A and B are the two estimates 4. If Z < -1.645 or Z > 1.645 Difference is Significant at 90% confidence How do I do a significance test?
Obtaining Standard Error from MOE is Key • Sum or Difference of Estimates • Proportions and Percents • Means and Other Ratios There are different formulas Consult Appendix 3 in the “Compass for Understanding and Using ACS Data: What General Data Users Need to Know” Report Series. JUST CLICK HERE Where…. http://www.census.gov/acs/www/Downloads/ACSGeneralHandbook.pdf
However HELP is Here PUSH BUTTON SIGNIFICANCE TESTER trbcensus.com/notes/StatisticalCalculationsMenu.xls
But what if I am using 2000 non-ACS Data? Click Graphic and review Chapter 8 where do I get my SEs?
You will need 2 things the Standard Error and Survey Design Factor Survey Design Factor X N = Size of publication area (population) Y = Estimate of characteristic
Survey Design Factor Get Survey Design Factors from the Census 2000 SF3 Technical Documentation, Chapter 8 Table C. Mode to Work 1.4 1.2 0.9 0.7 http://www.census.gov/prod/cen2000/doc/tablec-fl.pdf Insert state abbreviation for specific state
5Y = 5* 126,540 632,700 1 - (Y/N) = 126,540 / 362,563 1- 0.3490152 0.6509848 N = Size of publication area (population = 362,563) Y = Estimate of characteristic SE = 641.7772 Solve for the unadjusted Standard Error (SE)
Survey Design Factor X 126,540 / 362,563 = 35% SE = 641.777 Survey Design Factor at 35%-see slide 10 0.7 = Final Adjusted SE = 449 Adjust the SE by the Survey Design Factor
Calculate the ACS SE from the MOE Remember at 90% Significance Standard Error equals the MOE / 1.645
A B Calculate Z and test is Z < -1.645 or Z > 1.645?
Tempting is Z < -1.645 or Z > 1.645? Green is Significant This is NOT