Download

1 / 17
170 likes | 313 Views
http://xkcd.com/539/. Hypothesis Testing and Statistical Significance. Measurement Error and the Normal Curve. Chance (our error term) Individual measurement = exact value + chance error This is expected, it’s the basis for sample stats Outliers (individual cases)

E N D
http://xkcd.com/539/ Hypothesis Testing and Statistical Significance
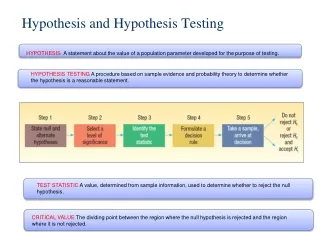
Measurement Error and the Normal Curve • Chance (our error term) • Individual measurement = exact value + chance error • This is expected, it’s the basis for sample stats • Outliers (individual cases) • Extreme measures that fall far outside the normal curve • Bias (all other non-random error) • Systematic error Do Not Forget: 3 Major Sources of Error
The Difference between Standard Deviation and Standard Error • Standard Deviation • Spread of a list • Single variables have SD • Standard Error • Spread of a chance process • Sampling Distributions have SE Graphics: Wikipedia
Remember how we use z-scores to plot values: Area under the normal curve • Example, you have a variable x with mean of 500 and S.D. of 15. How common is a score of 525? • Z = 525-500/15 = 1.67 • If we look up the z-statistic of 1.67 in a z-score table, we find that the proportion of scores less than our value is .9525. • Or, a score of 525 exceeds .9525 of the population. (p < .05)
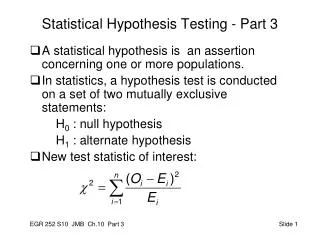
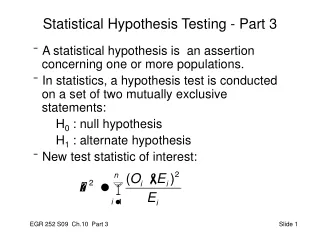
The Z-test as a hypothesis test • z is a test statistic • More generally: z = observed – expected SE • Z tells us how many standard errors an observed value is from its expected value.
One and two-tailed hypothesis testing • One-tailed test • Directional Hypothesis • Probability at one end of the curve • Two-tailed test • Non-directional Hypothesis • Probability is both ends of the curve
Logic of Hypothesis Testing: One-tailed tests • Alternative Hypotheses: • H1: μ1 < μc • H1: μ1 > μc • Null Hypothesis: • H0: μ1 = μc • Where μ1is the intervention population mean • μc is the control population mean
Logic of Hypothesis Testing: two-tailed test • Alternative Hypothesis: • H1: μ1 ≠ μc • Null Hypothesis: • H0: μ1 = μc • μ1is the intervention population mean • μc is the control population mean
Example 1 • Do Berkeley students read either more or less than the national average of 8 hours a week? • H0: μ = 8 The mean for Berkeley students is equal to 8 • H1: μ ≠ 8 The mean for Berkeley students is not equal to 8
Example 2 • Do Berkeley students read more than the national average of 8 hours a week? • H0: μ = 8 There is no difference between Berkeley students and other students • H1: μ > 8 The mean for Berkeley students is higher than the mean for all students
The meaning of p-value “The P-value of a test is the chance of getting a big test statistic-- assuming the null hypothesis to be right. P is not the chance of the null hypothesis being right. -Freedman et al. p. 481 Put differently: The p-value is the probability of obtaining a test statistic at least as extreme as the one that was actually observed, assuming that the null hypothesis is true.
Common Evaluation of p-values • When p value > .10 → the observed difference is “not significant” • When p value ≤ .10 → the observed difference is “marginally significant” or “borderline significant” • When p value ≤ .05 → the observed difference is “statistically significant” • When p value ≤ .01 → the observed difference is “highly significant”
More on Hypothesis Testing • We cannot hypothesize the null hypothesis • As odd as it may seem at first, we reject or do not reject the null; a traditional hypothesis test is evaluated against the null. Thus, we cannot “predict” no relationship and use hypothesis testing to “accept the null” as evidence that our prediction was upheld. • We never use the word “prove” with hypothesis testing and statistics, we reject or accept. • Prove has a specific meaning in mathematics and philosophy, but the term is misleading in statistics since statistics deals with probability and likelihood.
Types of Error • Type I Error: Falsely rejecting a null hypothesis (false positive) • Occurs when we think we are supporting our alternative hypothesis but the effect is not real (why might this happen?) • Type II Error: Failing to reject the null hypothesis when it is false (false negative) • Can occur with very conservative estimates.
Next Week • Two new statistical tests for examining relationships between pairs of variables • T-tests (testing the difference between two means) • Chi-Square (testing independence between two categorical variables) • Note that some of the readings are from Bernard, some from Freedman (I note the pages I want you to focus on, however).