Download
1 / 17
170 likes | 172 Views
This paper provides an overview of studies conducted to develop indicators for assessing technical innovation in research organizations. The research focuses on understanding key factors that foster excellence in the research environment and improving performance. The paper discusses various research projects that were selected for case studies and sponsored by the U.S. Department of Energy and the National Oceanic and Atmospheric Administration. It also highlights the need for better measures to determine performance in basic research and the challenges of measuring contribution to science and organizational goals.

E N D
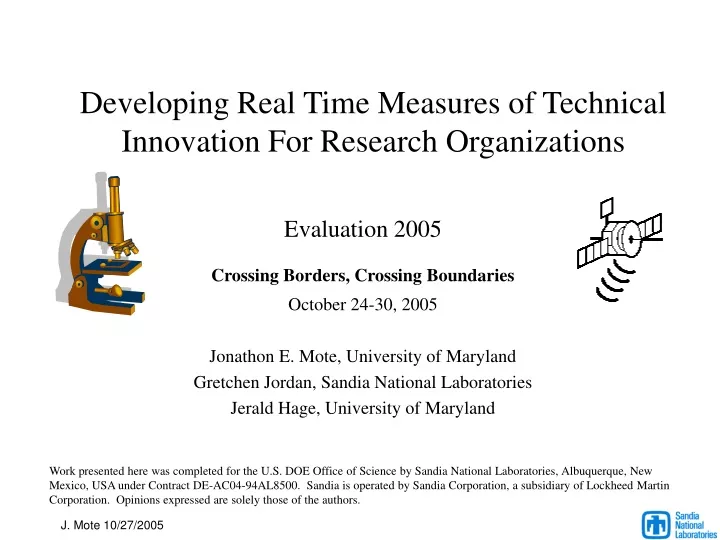
Developing Real Time Measures of Technical Innovation For Research Organizations Evaluation 2005 Crossing Borders, Crossing Boundaries October 24-30, 2005 Jonathon E. Mote, University of Maryland Gretchen Jordan, Sandia National Laboratories Jerald Hage, University of Maryland Work presented here was completed for the U.S. DOE Office of Science by Sandia National Laboratories, Albuquerque, New Mexico, USA under Contract DE-AC04-94AL8500. Sandia is operated by Sandia Corporation, a subsidiary of Lockheed Martin Corporation. Opinions expressed are solely those of the authors. J. Mote 10/27/2005
Developing S&T Indicators- An Overview of Our Studies • Research by Gretchen Jordan at Sandia National Laboratory in collaboration with Jerald Hage and Jonathon Mote at the Center for Innovation, University of Maryland • Part of a long-standing U. S. Department of Energy (DOE) Office of Basic Energy Sciences interest in understanding and developing tools to assess key factors in the research environment that foster excellence in order to improve. • 20 research projects selected for case studies at Sandia National Laboratories to develop progress indicators • 8 research projects sponsored by the National Oceanic and Atmospheric Administration (NOAA) Office of Research and Applications to develop a system of measures of operational and scientific performance • Performance measures for all projects developed in collaboration with researchers J. Mote 10/27/2005
Research Measurement – What’s Missing? • Intense interest in measuring research performance • Wealth of measures (indicators) of performance developed – publications, cites, patents, etc. • Systems of indicators often suggested • GPRA and PART accentuate need for good measures – budgetary pressures • Lack of good measures to determine performance in basic research • Difficulty of measuring contribution to science AND linkage to organizational goals. • Short-term criteria for control are often in conflict with the long-term criteria for evaluating value and strategy realization (Geisler, 2000). • Traditional measures that can be generalized across projects (Publications, awards, peer review ratings) are not easily linked to research strategies. • Traditional measures are often lagging indicators • Events based milestones can’t be tracked over time and describe only a portion of progress J. Mote 10/27/2005
Research Measurement – Definitions • Performance Indicator - Particular characteristic used to measure outputs or outcomes; a quantifiable expression used to observe and track the status of a process. An indicator constitutes the observable evidence of accomplishments, changes made, or progress achieved.2 • S&T – Basic and applied research and technology development, pre-new product development • Scientific – Work that has the near term objective of learning, increased understanding • Technological – Work that has the near term objective of developing a physical artifact with certain properties and functionality 2 OMB, Circular A-11 2003, Section 200-2. J. Mote 10/27/2005
Research Measurement – Developing Indicators • Characteristics to keep in mind for developing indicators of progress in basic and applied research and technology development: • Are important to researchers and drive research the right way, as well as meeting the needs of the organization for performance information • Can measure current performance in real time (at least annually) and are continuous so can be tracked across time (unlike events-based milestones) • Captures the specifics of the knowledge advances or technological functionality in a way that links progress to higher level strategies and objectives in both these areas (e.g. why it is worth publishing, patenting) • Captures multiple attributes of progress since research is complex, often with multiple constraints • Can be generalized so progress of similar projects or portfolios • Can be compared on these indicators (similar to peer reviews) • Can be aggregated for groups of projects to summarize progress for a field or sector or organization • Meet requirements of GPRA/PART (for public research organizations) J. Mote 10/27/2005
Research Measurement – Developing Indicators • Though these are important, our project does not try to: • Assess macro-level changes such as socio-economic outcomes • Assess contributions to human capital or knowledge networks/communities • Assess the general quality of the researchers, research plan, or management • Provide complements, rather than trying to be substitutes for current measures J. Mote 10/27/2005
Developing S&T Indicators – A View of the Entire Performance System • Identify measures that can be used up, down and across • Up – Linkages to organizational or mission goals and to knowledge base • Down – Real time to inform management practices • Across – Linkages across portfolios of research projects Socio-economic Outcomes Knowledge Base & Human Capital/ Communities of Practice Organizational Goals which are application/use of that progress • For Projects and • Portfolios of Projects: • Research Progress • scientific (ideas) • technological (tools) Other Research Progress Other Research Progress Management of Research J. Mote 10/27/2005
Developing S&T Indicators- Process for Defining Measures • Performance indicators developed in collaboration with researchers • Center for Innovation staff read project documents (proposals, progress reports) as well as studied current measurement systems and larger organization/mission goals • Identified key indicators of progress meeting desired characteristics (say more, as this is one of the “hard to do parts”) • Proposed these to researchers, modified so came to an agreement. Ideally the small set would be combined in a “figure of merit” • Looked for similarities and patterns across project-specific indicators to determine aggregate performance indicators (to be summed or compared across) • Key next steps • Define with experts, standards of performance to judge size or significance of the progress (tie to near term, say 5 years), such as degree of radicalness or scope of impact • Test the indicators (collect data, validate the indicator as reliable, useful, etc.) J. Mote 10/27/2005
Developing S&T Indicators - Project-Specific Indicators from Sandia • Distinction between science and technology projects (Science focused on precision; Technology focused on reliability) J. Mote 10/27/2005
Developing S&T Indicators - Aggregate Measures for Sandia Projects • Aggregate measures provide comparison across a range of projects • Technology projects • Reliability • Efficiency • Precision • Flexibility • Miniaturization/reduction in size • Ease/Speed of Use/Training • Science projects • Precision of prediction • Complexity of model • Validation metrics J. Mote 10/27/2005
Developing S&T Indicators - An Ideal Measure from Sandia? • A figure of merit captured interactions among indicators, complexity of problem addressed • Project focused on miniaturized front-end radar receiver • Overall figure of merit focused on four product parameters • In-band insertion loss • In-band return loss • Tunability • Out-of-Band Rejection • Overall figure of merit • Normalization of four parameters • Ideal - Lossless brickwall filter with infinite tunability =1 • Tuning range limits target to .3. • Chart progress through simulations and prototypes. J. Mote 10/27/2005
Developing S&T Indicators - Linking indicators at all levels Mission Goal: Support the Nation’s Commerce with Information for Safe and Efficient Transportation Agency Indicator: Increased accuracy of forecast for winds. U of M: % increase in accuracy of winds forecast Baseline: Accuracy of winds forecast in FY04. Target: % improvement in forecast prediction by FY05. Increase accuracy of forecast for winds and waves (marine forecasts) Program Office of Research and Application Indicator: Increased operational capability U of M: Number of operational products Baseline: Number of operational products in FY04 Target: Number of operational products in FY05 Increase operational capability of ORA Component Indicator: Increase number of operational winds products U of M: Number of operational winds products Baseline: Number of winds products in FY04 Target: Number of winds products in FY05 Winds Transition MODIS winds data to operational product Activity Indicator: Increased accuracy of satellite data on winds. Unit of Measurement: % increase in accuracy of wind forecast. Baseline: Accuracy of forecast in FY04. Target: % improvement of forecast accuracy with new data. MODIS Research new data on winds and conduct impact studies J. Mote 10/27/2005
Our scheme Socio-economic Outcomes Contribution to Knowledge Base & Human Capital/ Communities of Practice Contribution to Organizational Goals which are application/use of that progress Other Research Progress Other Research Progress • Research Progress • understanding (ideas) • technological (tools) Management Practices Developing S&T Indicators - Linking Operational and Customer Perspectives in a Balanced Set of Indicators Such as a Scorecard Strategy Map/ Balanced Scorecard – 4 Perspectives for Measurement Our areas of concern Mission Perspective Customer’s Perspective Organization’s Perspective Organizational Learning Perspective J. Mote 10/27/2005
Developing S&T Indicators - Project-specific Measures from NOAA/ORA • Greater homogeneity among projects in this organization of 100 researchers • All projects involve some amount of calibration/validation • All projects share parameters of operational satellites • All projects involve improving existing satellite data products • All project involve developing new products based on new satellite instruments • All projects involve development of new algorithms or improvement of old algorithms. • Examples of Performance Measures from Calibration/Validation • Calibration/Validation • Reduction in frequency of calibration/validation • Decrease in size of errors in data • Increase in coverage of data. • Algorithms • Increase in longevity of • algorithm • Decrease in size of errors in data • Increase in coverage of data. • Time Series • Increase in duration of time series • Decrease in inter-annual or inter-satellite variation of data • Increase in coverage of data J. Mote 10/27/2005
Aggregate Measures Impact on Weather Prediction Models • Improved prediction (accuracy, precision, coverage) • Development of improved models (either more or less variables) • Reduction in product development time Developing S&T Indicators - Aggregate Measures from NOAA/ORA • Research projects have many characteristics in common • All projects focused on satellite data • Data products typically assimilated into large-scale weather prediction models after impact studies • Critical missing link • Ability to demonstrate impact in a timely manner requires assimilation into large-scale models • Joint Center for Satellite Data Assimilation – demonstration effort to bring together all partners in weather prediction J. Mote 10/27/2005
Developing S&T Indicators - Putting It All Together Progress Indicators Are Essential for an S&T Organization’s Larger Performance Scorecard J. Mote 10/27/2005
Summary and Next Steps • Advantages of our measures • More accurate portrayal of research performance • Allows for aggregation and comparison across projects • Allows for demonstrating the impact of research at higher levels of organization for GPRA and PART (for public research) • Important for management decisions • Takes into account both similarities and differences in types of research • Allows for real-time tracking of research performance – not simply benchmarks or milestones • Next steps • Continued work at ORA involving product development time • Additional case studies • Need to link performance on these S&T indicators to perceptions of the research environment J. Mote 10/27/2005