Download
1 / 46
460 likes | 461 Views
This presentation discusses a multivariate regression analysis on the socio-economic factors affecting Richmond's journey-to-work transit trip-making. It complements existing transit plans by identifying the most significant factors and their impacts on transit use. The study utilizes data from the 2000 Census Transportation Planning Package and other socio-economic variables.

E N D
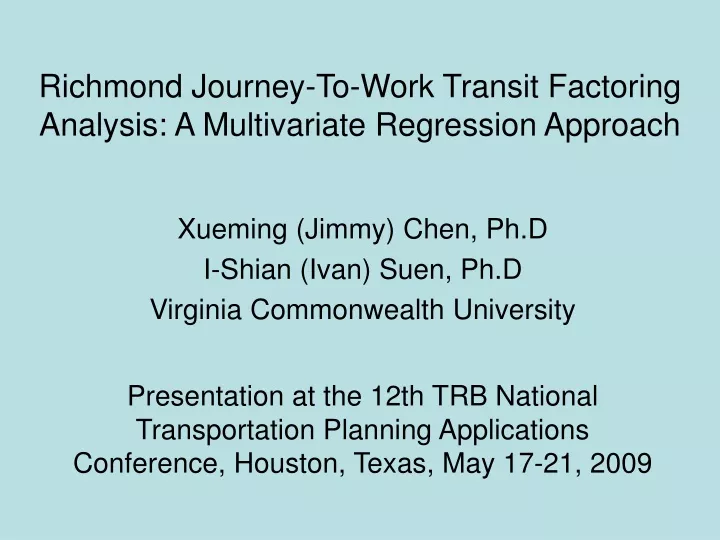
Richmond Journey-To-Work Transit Factoring Analysis: A Multivariate Regression Approach Xueming (Jimmy) Chen, Ph.D I-Shian (Ivan) Suen, Ph.D Virginia Commonwealth University Presentation at the 12th TRB National Transportation Planning Applications Conference, Houston, Texas, May 17-21, 2009
Profile of Richmond, Virginia • Richmond is the capital city of the Commonwealth of Virginia. The City, along with its surrounding counties, forms the Richmond metropolitan region, which had a total population of 822,416 and a total employment of 617,578 in the year 2000.
Modal Share Change in Richmond • According to the Richmond Regional Planning District Commission (2008), the number of commuters that drove alone to work rose from 1990 (78% modal share) to 2000 (82% modal share). In contrast, the use of public transit declined from 4% in 1990 to 2% in 2000.
Transportation Challenges in Richmond • Increasing incompatibility of the existing hub-and-spoke transit network with the future travel pattern due to suburbanization; • Lack of transit services in some high transit-demand areas; • Absence of high-capacity transit facilities along key corridors; and • Limited funding/jurisdictional support for upgrading transit services.
Major Transit Plans • Greater Richmond Transit Company (GRTC): Comprehensive Operations Analysis (COA) in March 2008; • Richmond Regional Planning District Commission (RRPDC): Richmond Regional Mass Transit Study (RRMTS) in May 2008; and • Virginia Commonwealth University (VCU): Transit-Oriented Development (TOD) Studies along the region’s key transportation corridors in May 2008.
Limitations of Existing Plans • The above studies identified a wide range of factors influencing residents’ use of transit services. However, they fell short of statistically identifying the most significant factors and their relative impacts on transit trip-making.
Research Methodology • This study intends to complement existing transit plans by conducting a rigorous statistical/GIS analysis on the socioeconomic variables affecting Richmond’s journey-to-work transit trip-making.
Data Sources • The principal data source is the year 2000 Census Transportation Planning Package (CTPP): Part I (At Place of Residence) and Part II (At Place of Work); • Since most GRTC fixed-route bus transit services are provided within the City of Richmond, only those transportation analysis zones (TAZs) within the City boundary are included for analysis; and • Other socioeconomic data used in this analysis include population density, automobile density, household density, and employment density.
Richmond Transit Analysis • This study carries out the statistical analyses for Richmond’s journey-to-work transit trip-making in two phases: 1) a multivariate stepwise regression analysis; and 2) a cluster analysis. • Out of the 216 TAZs in Richmond, only the ones with workers taking bus were included in the analyses. This leads to 137 valid TAZs in the production-side analysis and 143 valid TAZs in the attraction-side analysis.
Statistical Results of Regression Analysis – Production Side • Tables 2 through 4 show correlation matrix and final model of stepwise regression results for the production-side transit use; • The most important factor is bus stops per worker (variable name: bstopwkr, beta weight: .636). This indicator measures bus transit accessibility, and serves as a proxy variable for walking distance to bus stop, number of bus routes and nearby bus stops, etc.;
Statistical Results of Regression Analysis – Production Side (cont.) • Auto density (variable name: autoden, beta weight: -.453) is clearly a very important variable negatively impacting transit use; • Population density (variable name: popden, beta weight: .359) has a positive impact on transit use; • Another important variable affecting worker’s transit use is the percentage of those workers whose households are below poverty level (variable name: belowp, beta weight: .311). This makes sense because captive transit riders do not have other choices but take transit;
Statistical Results of Regression Analysis – Attraction Side • Tables 5 through 7 show correlation matrix and the final model of stepwise regression results for the attraction-side transit use; • Overall, attraction-side regression equation yields a lower R-square (.497) than production-side one (.781). This is in line with the general pattern that trip attraction model is generally less accurate than trip production model;
Statistical Results of Regression Analysis – Attraction Side (cont.) • The following five variables positively impacted workers’ decisions to take bus transit in the year 2000 at place-of-work: • Percentage of zero-vehicle workers (variable name: zerov, beta weight: .396 ); • Percentage of workers whose households are below poverty status level (variable name: belowp, beta weight: .216 ); • Percentage of workers traveling during peak periods (variable name: peak, beta weight: .205); • Percentage of disabled workers (variable name: dispct, beta weight: .156); and • Bus stops per worker (variable name: bstopwkr, beta weight: .156).
K-Means Cluster Analysis • This study performs both production-side and attraction-side cluster analyses. • The K-Means Cluster Analysis is used to classify Richmond TAZs into two clusters. The K-Means Cluster Analysis used belowp, autoden, popden, and senior variables from the regression results.
Statistical Results of Cluster Analysis (Production Side) • According to the cluster center statistics (Table 9), Cluster 2 highlights the main characteristics of TAZs that might have a greater demand for transit use by workers. Compared to Cluster 1, Cluster 2 has a much lower auto density and a higher senior worker percentage, in spite of lower popden and belowp values.
More on the K-Means Cluster Analysis (Production Side) • The K-Means Cluster Analysis also computed the distance from each TAZ to its cluster center. For Cluster 2, the distance measure can serve as an indicator of the potential of workers’ use of transit in a TAZ, where shorter distances indicate higher potential while longer distances indicate the TAZs are less homogeneous and farther away from the cluster center (Fig. 6).
More on the K-Means Cluster Analysis (Production Side, cont.) • When mapped with the 1/4-mile buffer around bus stops (Fig. 7), one can see the areas in Cluster 2 that have greater transit use potential but not yet served well by existing transit services. These areas are largely located in the urban fringe and outlying portions of the City.
Statistical Results of Cluster Analysis (Attraction Side) • This study also conducted the K-Means Cluster Analysis for the attraction side, yielding the results shown in Table 10, Fig. 8, and Fig. 9. When compared to Cluster 2, Cluster 1 is obviously more transit-prone, due to its higher zerov, belowp and peak values, in spite of a slightly lower dispct value. • Overall, attraction side has a high transit demand closer to downtown area. Except for some spotty areas, most of attraction-side transit demand is met. This situation is much better than production side.
Summary of Findings • At present, downtown Richmond is well served by GRTC bus services. However, some outlying urban fringe areas (particularly South Side, Midlothian, Broad Rock, Huguenot Districts) are still underserved due to sparse transit network coverage and inaccessible bus stops.
Summary of Findings (cont.) • The existing hub-and-spoke transit system is being challenged by the future suburbanization trend. Because of that, instead of exclusively investing on downtown-bound bus/rail transit routes, suburb-to-suburbs transit services should also be considered and strengthened by GRTC.
Summary of Findings (cont.) • This study reveals that production side has higher unmet transit needs than attraction side. Therefore, local governments and transit planning agencies need to pay more attention to improving bus transit services in areas with greater potential of transit use.