Download
1 / 13
130 likes | 251 Views
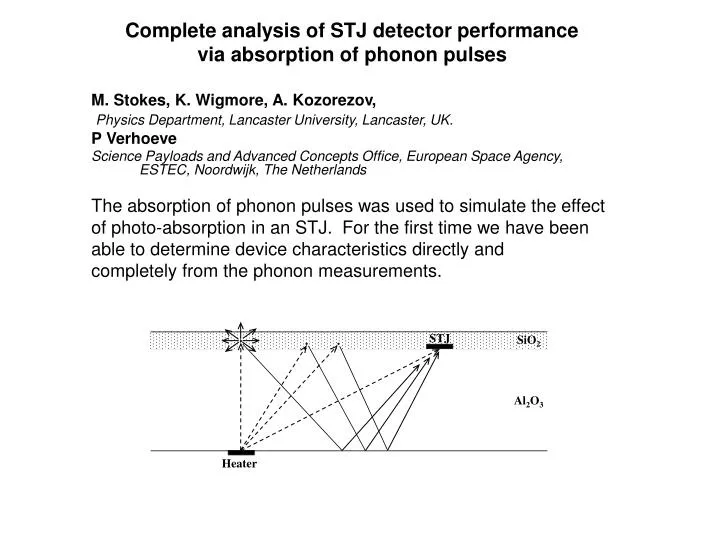
STJ. SiO 2. Al 2 O 3. Heater. Complete analysis of STJ detector performance via absorption of phonon pulses M. Stokes, K. Wigmore, A. Kozorezov, Physics Department, Lancaster University, Lancaster, UK. P Verhoeve

E N D
STJ SiO2 Al2O3 Heater Complete analysis of STJ detector performance via absorption of phonon pulses M. Stokes, K. Wigmore, A. Kozorezov, Physics Department, Lancaster University, Lancaster, UK. P Verhoeve Science Payloads and Advanced Concepts Office, European Space Agency, ESTEC, Noordwijk, The Netherlands The absorption of phonon pulses was used to simulate the effect of photo-absorption in an STJ. For the first time we have been able to determine device characteristics directly and completely from the phonon measurements.
Solution of Rothwarf-Taylor Equations where: QB(t) is the integrated charge developed in the base electrode after time t
Determination of Device Parameters The measured quantities, are respectively, the pulse decay constants, number of excited qps, peak current, and total integrated charge. The four fundamental parameters of each STJ, the tunnel rate and loss rate for each electrode can then be determined via the following simultaneous equations:
STJ Characterisation using Phonons + Simulates key stage of qp excitation by heat pulses + Pulse profile can be observed directly to determine decay times + Measure initial current directly to obtain number of qps + Energy input variable continuously over wide range + Uniform response across whole STJ area - High energy range only (lowest 50 keV at 1.3K, 1keV at 20mK) Absorption only in the base film Phonon system must be thoroughly understood separation of longitudinal and transverse modes energy spectrum scattering focussing Wolfe J.P. “Imaging Phonons” Cambridge Univ. Press
Experiment: Ballistic phonon image for sapphire by Every et al. at 1.6 K. Detector and excitation faces are highly polished and cut in the R-plane direction, the plane of ESTEC wafers. The image is a ±32º horizontal scan with the R-plane direction at the centre of the pattern. Bright regions indicate regions of high energy flux due to phonon focussing. Theory Modelledmap of fast (FT), and slow (ST) transverse focussing singularities. The thick line represents the slow transverse critical-cone channelling contour and the dashed lines are ‘precursors’. Phonon Focussing
highly de-focussed T peak slightly focussed T peak KJL #7 KJL #8 Phonon Focussing observations • Data shown below for two different STJs on the same chip but in different directions relative to the heater. The L mode is barely focussed in sapphire so the magnitude of the L flux is the same in all directions. Thus the L flux is isotropic and can be calculated from input heater power via the average focussing ratio 0.11 However the focussing ratio (L/T) is very different in the two directions shown and the magnitude of the T flux is obtained via the observed the focussing ratio for the specific STJ.
Phonon Energy Distribution: theory • The simplest model of the heater assumes that thermal equilibrium exists between the electrons and phonons so that the spectrum of emitted phonons is a Planck distribution at a single temperature determined by the Stefan-Boltzmann law: (P heater power, A area, T heater temperature) • However, this cannot be correct because the mean free paths of most electrons and phonons are predominantly larger than the thickness of the film. • Perrin and Budd (Phys. Rev. Lett. 28 p1701 1972) modelled the form of the spectrum emitted from a thin film heater in this scenario, but material details are not well known, such as film structure, and mean free paths for phonon and electron scattering. • The form of the spectrum displays two peaks, the lower energy corresponding to complete thermalisation of the phonons, and the higher energy to incomplete thermalisation.
Phonon Energy Distribution: experiment • By differentiating the phonon response with respect to heater power we can use the 2Δcut-off to determine the phonon energies and hence the effective temperature of the energetic phonons. A peak in the derivative will occur when a maximum in the spectrum, equal to 2.8kT, coincides with 2Δ. incomplete thermalisation complete thermalisation CVT #5 • The 1st peak corresponds to the high energy phonons (incomplete thermalisation). We modelled this as Stefan Boltzmann with a lower pre-factor, χ, in the SB relation is reduced from 121, calculated for Al-sapphire • By reinserting χinto the SB relation an effective phonon “temperature”, can be defined in order to determine N0.
Phonon Scattering • Phonons can be scattered in the bulk of the substrate, at interfaces and within passivation layers. • Elastic and inelastic scattering m.f.p in sapphire >> sapphire thickness. • In amorphous passivation layers phonons can scatter back into substrate, reflect off bottom interface and be absorbed in STJdelayed phonon signal. • Scattered phonons result in a deviation of the decay of the pulse, adding uncertainty to ε1 and ε2. • By keeping the heater power low, diffusive scattering can be minimised. scattered phonons KJL #7
Summary of Experimental Data • Pulses are those used to determine device parameters. KJL #8 KJL #7 CVT #5
STJ tunnelling and loss times • τt,2is calculated assuming tunnel times scale with electrode thickness, due to uncertainties in ε1. • Vb = 400 μV • Tunnel times compared to theory
a mobile qp recombines with a trapped qp emitting a sub-gap phonon (<2Δ) the phonon is immediately lost from the STJ the trap is immediately occupied by a further mobile qp thus the process is super-linear in qp density Trap-enhancedrecombination – origin of the initial decay?
ConclusionsThe phonontechnique complements photo-absorption to give interesting and valuable information on the properties of STJs.It can provide a complete quantitative analysis of device parameters.In addition its versatility provides a alternative approach to broader physical problems, such as trapping and recombination.