Download
1 / 10
110 likes | 253 Views
DAMOP 2010. Ultraslow Dissociation of H 2 + Via Intense Laser Pulses. Presented by: Brad Moser And George Gibson. - A two-color laser experiment presented itself:. - 800 nm pulse to bond-soften. - 400 nm pulse to resonantly excite to 3d s g. DAMOP 2010. A Bound State.

E N D
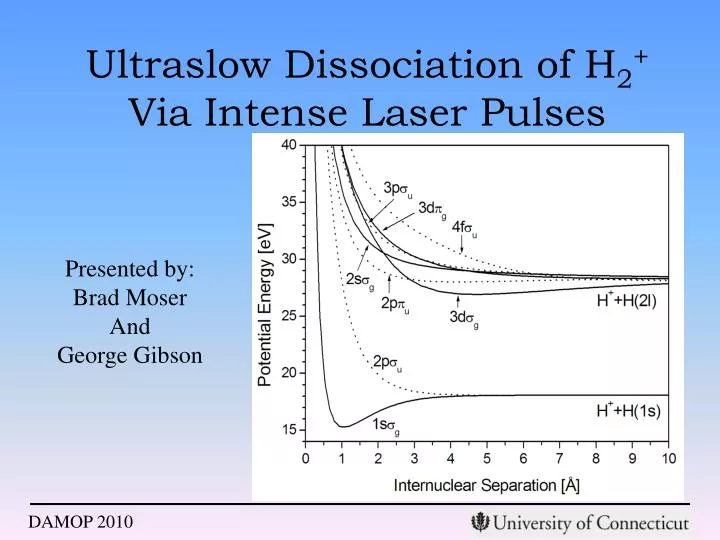
DAMOP 2010 Ultraslow Dissociation of H2+ Via Intense Laser Pulses Presented by: Brad Moser And George Gibson
- A two-color laser experiment presented itself: - 800 nm pulse to bond-soften - 400 nm pulse to resonantly excite to 3dsg DAMOP 2010 A Bound State - Our driving force is to control excitation of H2+ - Population of the bound 3dsg state is a priority - Detectable via: - Vibrational signature in TOF - Molecular fluorescence - We found something new…
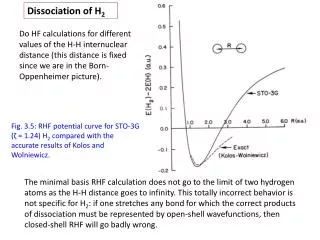
Bond-softeningwith 800 nm photon BS with400 nm DAMOP 2010 One-Color Floquet Model Laser pulse is 5x10¹² W/cm2
Emission of red photoncreates an outer well. BS with400 nm SlowDissociation DAMOP 2010 Two-Color Floquet Model Blue and Red pulses, each 5x10¹² W/cm2,superposed in time and space.
DAMOP 2010 TOF Spectra1-Color Interactions - Graphs show H+ ion signal vs ion momentum - Top graph: Experimental TOF data - Bottom graph: Numerical calculation
Ultraslow Dissociation DAMOP 2010 TOF Spectra:2-Color Interactions - Graphs show H+ ion signal vs ion momentum - Red pulse held at 2x10¹³ W/cm2 - Blue pulse varied from 1 to 4 x10¹³ W/cm2
- 1wblue is shifted to Ultraslow Dissociation - Peak between 1wblue and 1wred is induced by outer well DAMOP 2010 TOF Spectra2-Color Interactions - Red pulse and Blue pulse are each 2x10¹³ W/cm2 - Effects:
800 nm dissociation: 800+400 nm dissociation:
DAMOP 2010 Changing Potential Well Blue pulse has longer duration, therefore blue gap remains open while red effect drops out.
DAMOP 2010 Conclusions • -With 12 laser pulses, it is possible to produce ultraslow dissociation of hydrogen, the lightest molecule. • -Such slow dissociation will allow us to probe the excited state structure of H2+. • We see evidence of time-dependent potential wells in the dissociate energy of the fragments. • For more details: Phys. Rev. A, Rapid Comm. 80, 041402(R) (2009)