Download
1 / 27
270 likes | 274 Views
Characterizing Cloud and Convection Using the YOTC CloudSat-Centric, Collocated A-Train and ECMWF Data Set. Wei-Ting Chen Department of Atmospheric Sciences, NTU Collaborators at NASA JPL:

E N D
Characterizing Cloud and Convection Using the YOTC CloudSat-Centric, Collocated A-Train and ECMWF Data Set Wei-Ting Chen Department of Atmospheric Sciences, NTU Collaborators at NASA JPL: Duane Waliser, J.-L. Frank Li, Terry Kubar, Brian Kahn, Eric Fetzer, Seungwon Lee, Lei Pan, Paul von Allmen Nov. 06, 2012 Workshop on Aerosol, Cloud, Climate, and Chemistry
Large uncertainties in GCM atmospheric water estimates • IPCC CMIP3 and CMIP5 GCMs show strong disagreement in atmospheric ice and liquid water estimates, partly owing to the lack of observational constraints. • Global mean IWP in CMIP3 GCMs can differ by 20X. Even when the extreme outliers are removed, the spread is still 6X. (Waliser et al., 2009) • Global mean LWP in CMIP3 GCMs also differ by 3-10X (Li et al., 2008) CMIP3 GCM IWP (g m-2)
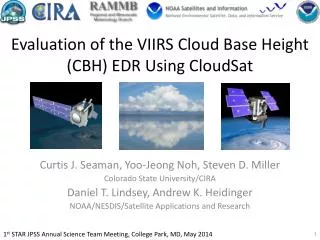
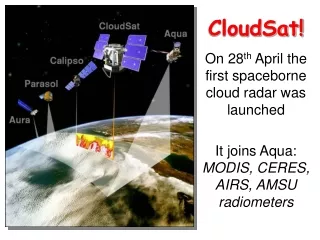
CloudSat provides useful observational constraints of vertically-resolved atmospheric hydrometeors • The Cloud Profiling Radar • z ~ 500m (125 bins); x ~1.5 km; t = 0.16 s • Vertically resolved hydrometeor and microphysical properties retrieved from radar reflectivity • Ice/liquid water content (IWC/LWC) • Ice/liquid particle size distribution parameters (number (Nc), width (), and effective size (re) )
ICE ICE ICE SNOW MIXED GRAUPEL LIQUID LIQUID LIQUID RAIN CloudSat provides useful observational constraints of vertically-resolved atmospheric hydrometeors • CloudSat estimates are expected to considerably help reduce the uncertainties associated with model representation of atmospheric ice and liquid water. • Owing to differences in instrumental sensitivity and model representation of atmospheric ice and liquid, the comparisons of modeled ice water with retrieved estimates require careful consideration CloudSat is sensitive to multiple hydrometeor types
GCM atmospheric ice representations are diverse • Most “conventional” GCM’s provide prognostic cloud ice (small particles), while assuming immediate fall-out for large precipitating ice (w/ or w/o sedimentation). • GCM’s embedded with cloud-resolving model or GCM’s with more sophisticated microphysics schemes are able to provide prognostic cloud ice and precipitating ice. Single Species Ice Scheme (conventional GCM) Three-Species Ice Scheme (more sophisticated model)
GCM atmospheric ice representations are diverse • Most “conventional” GCM’s provide prognostic cloud ice (small particles), while assuming immediate fall-out for large precipitating ice (w/ or w/o sedimentation). • GCM’s embedded with cloud-resolving model or GCM’s with more sophisticated microphysics schemes are able to provide prognostic cloud ice and precipitating ice. • For the remotely-sensed estimates, a method to distinguish the cloud versus precipitating ice components is needed and valuable in order to carry out meaningful model-data comparisons. • Implication for radiation, heating rate, and dynamic feedbacks in the models (e.g. Waliser et al., 2010; Wang et al., 2010)
Separate cloud and precipitating ice: Use CloudSat retrieved ice particle size distribution P (hpa) qi(p) qi(p) qi(p) CloudSat dN(D)/dD qi(p) D CloudSat retrieved ice particle size distribution IWCTOTAL= integral of PSD over all sizes (Chen et al., 2011, JGR)
Separate cloud and precipitating ice: Use CloudSat retrieved ice particle size distribution P (hpa) qi(p) qi(p) qi(p) CloudSat dN(D)/dD qi(p) Dc= cut-off threshold between small and large ice particle D Dc IWC<Dc = “Small” Ice Mass (cloud ice) IWC>Dc = “Large” Ice Mass (precipitating ice) (Chen et al., 2011, JGR)
IWC: CloudSat vs. ECMWF and fvMMF models CloudSat IWCTOTAL CloudSat IWC>150 CloudSat IWC<150 ECMWF CY31r1 IWCTOTAL fvMMF IWCTOTAL fvMMF IWC>150 fvMMF IWC<150 (Chen et al., 2011, JGR)
Evaluating IWP in CMIP5 models with observational constraints (PSD partitioning and other methods) (Li et al., 2012, JGR)
Evaluating IWP in CMIP5 models with observational constraints (PSD partitioning and other methods) CCSM4 IWP Obs. Multi-mean CIWP CCSM4 IWC Obs. Multi-mean CIWC (Li et al., 2012, JGR)
CloudSat footprint (target) AIRS footprint, not co-located AIRS footprint, co-located MODIS footprint, not co-located MODIS footprint, co-located The YOTC CloudSat-centric, Multi-parameter A-Train and High-resolution ECMWF Analyses Data Set • As a contribution to the WMO Year of Tropical Convection (YOTC) research activity (May, 2008 - May, 2010) • An efficient and flexible algorithm is developed for nearest-neighbor finding (lead by P. von Allmen and S. Lee) • Along CloudSat track, collocate parameters from selected A-Train products and ECMWF analyses (0.5o ERA-Interim and 0.125o YOTC-ECMWF high-res. output) • To better quantify the dynamic, radiative, and microphysical properties of clouds and convections. Image Credit: Alex McClung
MLS CERES UTLS –T(p), ql(p), qi(p), CO (p), O3(p), HNO3(p) TOA and SFC radiative fluxes P (hpa) CALIPSO Aerosol (p) Cloud (p) < ~3 qi(p) AIRS q(p), T(p) CloudSat qi(p) & IWP ql(p) & LWP Cloud Type (p) Particle Size (p) Light Precip MODIS ECMWF (p), q(p), T(p) u(p), v(p) … Aerosol Opt Depth Cloud Top - T, p, Particle Size… ql(p) AMSR Precipitation SST Prec Water LWP Surf. Wind Speed Light Precip
Apply the collocated A-Train data set to study tropical deep convection clouds: A first look • Over Tropical (20N-20S) Ocean; July 2008 • Deep convection (DC) clouds: identified by CloudSat cloud class algorithm • Collect and analyze statistics of CPR profiles with collocated retrievals • AIRS (T, q, RH) • AMSR-E precipitation rate
CloudSat(IWC,cloud type) + AMSR-E(rain rate) + AIRS(T,q,RH) (Jul 2008) IWC q T RH 5-year radiosonde and precipitation gauge data at Nauru Island (Holloway and Neelin, 2009) Consistent trends: A strong association between rainfall and moisture variability in the free troposphere PPT (mm/hr) PPT (mm/hr) q RH
3hr-ave Prec. (mm/hr) CloudSat(IWC,cloud type) + AMSR-E(rain rate) + AIRS(T,q,RH) (Jul 2008) IWC q T RH YOTC ECWMF model forecast (0.125x0.125 resolution, Jul 2008) IWC q T RH Less variability in low level moisture “drying” in heaviest precip. bins -- owing to parameterized subsidence??
Characterizing cloud, convection during MJO events using the collocated A-Train data set • Selected area: 5N-10S, 65-85E • larger than the DYNAMO target areas so that enough statistics can be included) • Instruments: • CloudSat (IWC, LWC, cloud type) • AIRS (T, q, RH, OLR) • AMSR-E (Prec.,SST,WSD) • MODIS (COD, re) • CERES (SW/LW at TOA/Sur) • ERA-Int (T, q, RH, u, v, w) • Period: Two winter MJO seasons covered by the collocated data set (Nov–Apr, 2008 to 2010) • Total=362 days; 131 days missing (CloudSat downtime) Region to collect composite statistics in the present study (5N-10S; 65-85E) DYNAMO area of interest (0-7S; 72-79E) The shaded contours show the cloud top temperature on 21 UTC 12 Dec 2007. The square box is the DYNAMO area of interest, with key measurements planned at four primary observing sites (black dots) [The DYNAMO Overview Document]
Composites in MJO Phases Based on the Multivariate MJO Index [Wheeler and Hendon, 2004] • Period: Two main MJO seasons in the collocated data set (Nov ‘08 – Apr ‘09 & Nov ‘09 – Apr ‘10) • Total=362 days; 131 days missing (CloudSat downtime) • Label each day by MJO phase 1-8 (i.e. WH index, with amplitude >1); days with index amplitude <1 = “Non-MJO days” • Merge phases two by two to augment sample size • Compute PDF, PDF anomalies, mean and anomalies (relative to the Non-MJO cases)
PDF of Moisture in different MJO phases AIRS RH700 Clear sky ERA-Int RH700 Clear sky AMSR-E CWV All sky PDF ERA-Int, All sky PDF
PDF of Near-Surface Temperature AIRS Surface Air T ERA-Int Skin T AMSR-E SST PDF
PDF of Cloud Top, Optical Depth, and Precipitation CloudSat Cloud Top Pressure MODIS COD AMSR-E Rain Rate PDF
Mean RH profiles at different MJO phases AIRS mean RH ERA-Int mean RH AIRS RH anomaly ERA-Int RH anomaly
Anomalies of atmospheric water content and vertical velocity ERA-Int 500 anomaly CloudSat IWC anomaly CloudSat LWC anomaly
Mean RH profiles sampled with rain rate “Process-oriented Diagnostics” ofr MJO for GCM evaluation (Kim et al., 2009) AIRS RH ERA-Int RH ERA40 RH vs GPCP precip RH vs precip in GCMs
Single Variable EOF analysis: CloudSat Total Cloud Frequency CloudSat Total Cloud Frequency 1st and 2nd EOFs CloudSat Total Cloud Frequency Mean and STD 1st and 2nd PCs Grouped by MJO phase EOF1 84.3% 12345678No MJO phase Total CFCLDSAT (%) EOF2 7.6% 12345678No MJO phase
Coupled 3-Variable EOF analysis: Total CFCLDSAT, RHERA, ERA (0.1=17.9%) (0.1=29.2%) (0.1=0.03 Pa/s) PCs Grouped by MJO phase Total CFCLDSAT RHERA wERA EOF1 66.8% EOF2 13.7% EOF3 4.6%
Summary and Future Work • Satellite estimates of atmospheric hydrometeors provide valuable and necessary constraints for model evaluation. • Taking into account the differences between instrumental sensitivity and model parameterization design to carry out meaningful intercomparison • Synergistic use of remote sensing data, e.g. the YOTC collocated A-Train data set, can support and facilitate the study of clouds and convection, and their relationships with large-scale environment • The present work applies the collocated data set to characterize tropical deep convection, with special focus on boreal winter MJO over Indian Ocean • Ongoing Work • Uncertainty quantification and statistical significance tests (all suggestions are welcome!) • Interpretation of statistics/diagnostics to characterize the moisture structure and the evolution of cloud populations • Focusing on implications/suggestions for models improvements and evaluations