Download
1 / 32
320 likes | 327 Views
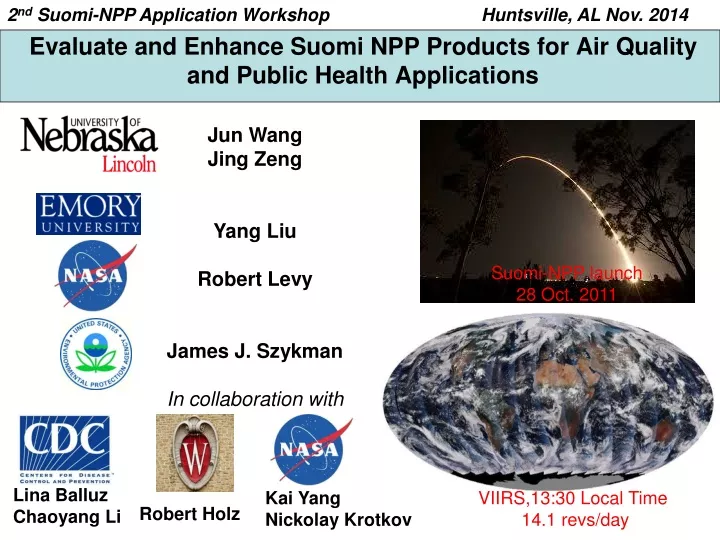
2 nd Suomi-NPP Application Workshop. Huntsville, AL Nov. 2014. Evaluate and Enhance Suomi NPP Products for Air Quality and Public Health Applications. Jun Wang Jing Zeng Yang Liu Robert Levy James J. Szykman In collaboration with. Suomi-NPP launch 28 Oct. 2011. Lina Balluz

E N D
2nd Suomi-NPP Application Workshop Huntsville, AL Nov. 2014 Evaluate and Enhance Suomi NPP Products for Air Qualityand Public Health Applications Jun Wang Jing Zeng Yang Liu Robert Levy James J. Szykman In collaboration with Suomi-NPP launch 28 Oct. 2011 Lina Balluz Chaoyang Li Kai Yang Nickolay Krotkov VIIRS,13:30 Local Time 14.1 revs/day Robert Holz
Objectives • PM2.5applications • Evaluate and improve the application ofthe (MODIS-type if possible) VIIRS aerosol product for the operational monitoring of PM2.5 air quality in EPA’s Remote Sensing Information Gateway (RSIG) • Subsequently transfer RSIG’s PM2.5 estimates to the CDC’s Environmental Public Health Tracking Network (EPHTN) • Evaluate and improve VIIRS-RSIG PM2.5 estimates for enhanced spatial predictions in on-going EPA-CDC EPHTN efforts, currently using CMAQ model output and filter-based PM2.5 observations from EPA-AQS. • Public heath (skin cancer research) applications • Incorporate OMPS-based estimates of surface UVB irradiance and erythemal doses into the CDC’s EPHTN, and apply them in both public heath advisory and skin cancer research.
Work/Data Flow & Approaches Black: datasets & model already in place; green:existing model capability and data flow that will be improved; red:the data and data flow will be created
National Ambient Air Quality Standards NAAQS as of Oct. 2011 12 μg/m3, FR, 15 Jan. 2013
Proposed change for 24-hour PM2.5 NAAQS Slide from J. Szymkan et al., 2012 AGU
Existing PM2.5 monitoring in continental U.S. 20 June 2013 21 June 2013 Blue: ~1000 stations using Federal Reference Method (FRM) as part of Air Quality System (AQS). Measure daily PM2.5 at daily, every 3rd or 6th day frequency. Red: ~600 stations using a variety of techniques to provide continuous (hourly resolution) PM2.5 mass, in support of the AIRNow program. Still, many areas remain unmonitored.
Because ground-based measurements lacks spatial converge, using satellite data to estimate surface PM has been of high interest in air quality and public health community. 2003 2009 Hoff & Christopher, 2009
Challenges & Strategies • Challenges: • Vertical distribution, particle size distribution, aerosol composition, sampling bias • Cloudy conditions • Strategies: • Ensemble modeling using WRF-Chem, WRF-CMAQ, and GEOS-Chem • Spatial & statistical modeling Satellites Models aircraft, ships, sondes, lidars Surface sites
Approach: Integrated use of VIIRS Reflectance in a CTM VIIRS Reflectance VIIRS VIIRS/NPP VIIRS = WRF-chem ? = + / (/) VLIDORT (Spurr,2006) surface reflectance in blue wavelengths Reflectance WRF-chem & Jacobian / scale the aerosol mass WRF-chem AOD() and 3D aerosol mass
Places that are not in compliant with NAAQS New Annul PM2.5 Standard (12 μg/m3)
Field Experiment, August 2012PM2.5 and AOD are measured at 7 locations in N. Atlanta
High variability of AOD in urban regions VIIRS True Color Image VIIRS AOD (488 nm, standard product) : Atlanta city 01/Aug/2012
Variability of AOD VIIRS True Color Image VIIRS AOD (550 nm, IP product) : Atlanta city 01/Aug/2012
VIIRS 488 nm reflectance (@native 700 m resolution) vs. In-situ measured AOD and surface PM2.5
AOD IntercomparisonModeled AOD: underestimation by 0.1 VIIRS EDR: overestimation by 0.35VIIRS AOD from this work: overestimation by 0.04 Modeled AOD VIIRS AOD (this work) VIIRS EDR August 2012. We hope MODIS-type VIIRS AOD data will be better than EDR.
Surface PM2.5 Estimate WRFChem + VIIRS reflectance (This work) WRFChem only • Use of VIIRS reflectance: • reduces the model bias from -5.6 μg/m3 to 3 μg/m3 • increase R2 from 0.69 to 0.87.
Another case demonstrationPM2.5/AOD vary day to day 6/26/2012 6/26/2012 6/26/2012 6/26/2011
Real-time AQ forecast for High Plains • High-Plains Real-time Earth System Modeling Complex • WRF-Chem V. 3.5 • NAM data for initial and boundary met. Conditions, every 6 hrs • Fire emissions from FLAMBE, NRL-Monterey • Other emissions EPA. • Will have satellite images and data transferred to estimate near real-time of surface PM2.5 • http://www.eas.unl.edu/~esmc/
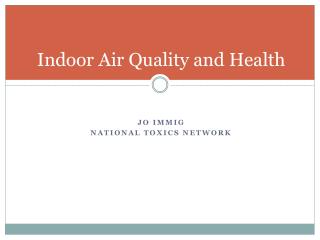
Application for Public Health (Skin Cancer Research) • One in five Americans will develop skin cancer in their lifetime. • The most severe type of skin cancer, melanoma, accounts for about 3% of skin cancer cases, but over 75% of skin cancer deaths. . • UV radiation in ambient sunlight is predominantly UVA (320 – 400 nm, 90%–95%) and UVB (290 – 320 nm, 5%–10%). • The correlation of melanoma incidence to UV radiation exposure is greater when ambient UVA radiation is also included together with UVB. Figure 1. U.S. invasive melanoma lifetime risk (Rigel 2010).
CDC’s Tracking System for skin cancer Screenshot of melanoma indicators on the Tracking website. Currently, Tracking does not have any indicators or measures of UV exposure.
Motivation of using remote sensing data • The major UV exposure data source for the past epidemiological studies is the UV index. In US, this index are estimated from the radiative transfer code in NCEP models by the National Weather Services (NWS) in major cities since 1996 and for most ZIP codes since 2005. • The National Solar Radiation Database (NSRDB) developed by National Renewable Energy Laboratory (NREL) also includes UV irradiance data, but most data are modeled, and only 40 sites have measured solar data—none of them with complete records; the data overall have large root mean square errors [Maxwell, 1998]. • Lately, Erythemal UV irradiances retrieved by the TOMS (available since 1978) have also been used as an indicator of UV exposure [J. Moan et al., 2008; Hatfield et al., 2009].
UV index (UVI), erythermally-weighted UV flux, and UV flux http://www.esrl.noaa.gov/gmd/grad/neubrew/docs/UVindex.pdf
By NOAA http://www2.epa.gov/sunwise/uv-index
UV index measured by NOAA http://www.esrl.noaa.gov/gmd/grad/neubrew/
Remote sensing of surface UV flux • Starting from TOMS and continued with OMI, and OMPS • OMI: erythemally weighted daily dose (Jm-2) and) erythemal dose rate (Wm-2) and spectral irradiances (Wm-2nm-1) at 305, 310, 324, and 380 nm for noon-time Flowchart of surface OMUVB algorithm (Tanskanen et al., 2006) with modifications. Note that the red section was recently implemented using the monthly-mean aerosol climatology as discussed in Arola et al. (2009).
Estimate of surface UV from OMPS • The OMPS-NM is similar as OMI except: • it measures 300 – 380 nm radiation at every 0.42 nm (OMI measures 270 – 500 nm); • it has a ground swath of 2800 km, larger than 2600 km of OMI; • in normal mode it has spatial resolution of 50 km at nadir, coarser than 24 km of OMI. • No surface UV estimate of OMPS yet. • We propose to apply similar algorithm as OMI to estimate erythemally weighted daily dose from OMPS by using • O3 from OMPS • Aerosols from VIIRS & OMPS and GEOS-Chem simulations • Look-up table and radiative transfer calculations • Assess with ground-based observations
An example GEOS-Chem AAOD OMI AAOD OMUVB UV daily dose (A) GEOS-Chem simulated AAOD in July 2005 at 0.5° × 0.67° resolution; filled circles are AERONET AAOD (only available on cloud-free days). (B) OMIAERUV AAOD at 388 nm, valid for elevated aerosol in cloud-free conditions. (C) OMUVB Erythemal UV Daily Dose (KJm-2).
Radiative Transfer Calculations Green: AOD = 0.2 at 550 nm for smoke aerosols.
Summary • Research Application is a good model. • Estimate of surface PM2.5 from VIIRS with ensemble approach – multiple models + multiple AOD products • Estimate of surface UV from OMPS – multi-data fusion + modeling • Ultimately, the estimates will be validated against ground-based observations. • End users are EPA and CDC.
Thank you ! Working with an interdisciplinary team in applied science is fun!
AGU session Advances in remote sensing of fires, aerosols, and trace gases for air quality applications19 Dec. 2014 63 abstracts 2 poster & 2 oral sessions • A51A, A51B, A53N, and A54B • Primary Convener: • Jun Wang, University of Nebraska - Lincoln, Lincoln, NE, United States • Co-conveners: • Xiong Liu, Harvard-Smithsonian CFA, Cambridge, MA, United States • Edward J. Hyer, Naval Research Lab Monterey, Monterey, CA, United States