Download
1 / 22
220 likes | 373 Views
NASA and NAAPS products for Air Quality decision-making . Douglas L. Westphal Naval Research Laboratory, Monterey, CA Rudolf B. Husar Washington University, St. Louis, MO Shawn E. McClure CIRA, Colorado State University, Ft. Collins, CO. Background.

E N D
NASA and NAAPS products for Air Quality decision-making • Douglas L. Westphal • Naval Research Laboratory, Monterey, CA • Rudolf B. Husar • Washington University, St. Louis, MO • Shawn E. McClure • CIRA, Colorado State University, Ft. Collins, CO
Background • Project Summary: Quantify the impact of Non-CONUS emissions on US AQ usingNASA and NAAPS data provided to AQ Decision-Makers through DataFed and VIEWS. • Baseline: • Exceptional events flagging • No standard information sources as evidence for EEs • Ad hoc flagging and reporting by the States • Background conditions for EPS Regional Haze Rule • No modeling studies of international influences were used to determine the default natural condition values • States lack standard method for quantifying impact • AQ Forecasting and sampling • LRT forecasts not freely available in a quantitative way
Approach • Exceptional events flagging • Distribute NAAPS via standard protocol through DataFed • Background conditions for EPS Regional Haze Rule • Use 10-year NAAPS reanalysis to identify background on 20% best and worst haze days • Use NAAPS sensitivity runs to estimate impact of projected emissions (e.g. HTAP scenarios) • AQ Forecasting and sampling • LRT forecasts distributed • NAAPS made available for boundary conditions for regional models • NAAPS forecasts used to guide measurements in field missions
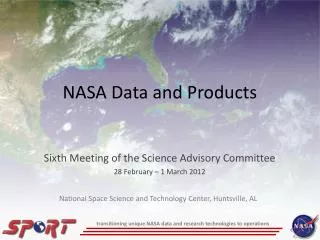
ROSES-2008 Air Quality: NASA and NAAPS Products for AQ Decision-making (PI Westphal) Earth System Models NAAPS - Operational global aerosol forecast model; six-day forecasts of aerosol plumes; 1996-present retrospective database FLAMBE Operational fire locating and emission system NAVDAS-AOD – Operational aerosol data assimilation system Predictions/Forecasts Decision Support Systems, Assessments, Management Actions NAAPS will provide an integrated way of improving on existing but questionable estimates of “natural background” conditions at IMPROVE sites as States develop SIPs in response to the Regional Haze Rule. NAAPS estimates of non-US source impacts on episodic US PM 2.5 concentrations, combined with the AQ data available on VIEWS and DataFed, will be extremely valuable for the EPA’s new “Exceptional Event” Rule, and provide information which is simply not available elsewhere. NAAPS served through VIEWS and DataFed will provide the first operational estimates of PM impacts from Non-US sources and will complement existing regional forecast models such as AIRPACT-3 and enable more accurate AQ forecasts. Combining NAAPS with other graphical products on the DSSs will support decision-making regarding sampling, data analysis, and risk assessment during field studies of particulate matter from international sources. NAAPS – Operational 6-day forecasts and 10-year database of 3-d distributions of aerosol species (sulfate, smoke, dust, salt), as concentrations, meridional and zonal fluxes, emissions, deposition and wet removal fluxes FLAMBE – hourly, global, biomass emission fluxes in real-time and archived since 2000 NAVDAS-AOD – 6-hourly, global 3-d distributions of aerosol species (sulfate, smoke, dust, salt), in real-time and back to 2000 • Value & Benefits • to Society • Better estimates of natural background conditions will lead to better implementation of the RHR and better visibility conditions in our National Parks in the future. • More accurate EE Rule implementation will make for a more accurate and less costly EE claim process and lead to faster attainment of the NAAQS. • Better daily AQ forecasts from local, regional and state agencies will lead to a better health and reduced fatalities. • More efficient and effective field studies will increase our understanding of our nation’s air quality issues and lead to scientifically sound regulations and faster attainment. Earth ObservationsCurrently used: MODIS MOD04 AOD dataset for data assimilation by NAVDAS-AOD MODIS and GOES data used in FLAMBE smoke emissions CALIPSO climatology used for data assimilation CALIPSO overpasses used for validation. Underway: MODIS Deep Blue over-land AOD running at NRL; to be used in NAVDAS-AOD MODIS Dust Enhancement Product and TOMS AI used to identify dust sources MISR-derived height, composition and AOD used in data assimilation and model validation. Future: AVHRR, METOP and other non-NASA AOD products in data assimilation NPP and NPOESS AOD used in data assimilation Observations, Parameters & Products
What is NAAPS? Navy Aerosol Analysis and Prediction System Purpose: Forecast of global concentrations for EO propagation, scene and radiance correction, with focus on lower tropospheric phenomena Method: Solve the advection-diffusion equation at each grid point for each species m : Advection and turbulent mixing: Controlled by dynamical model NOGAPS Sources and sinks: Dependent on dynamics and remote sensing Initial State: Based on previous forecast and remote sensing September 11, 2011 Key: Smoke = blue Dust = green Sulfate = red
NASA Data for NAAPS Sources Sources: Global sources are estimated for each species. Source estimates incorporate weather, remote sensing, and anthropogenic activity Example: Smoke released (kg) in each grid box is the sum of individual fires: Alarea burned: Updated in near real time using GOES and MODIS satellites wk vertical weights: Fixed, uniform in lowest kilometer Sep 7 2011 5-day SMOKE AOD FORECAST GOES and MODIS FIRE DETECTION SMOKE FLUX (Ssmoke)
NASA Data for NAAPS Initialization Forecasting is an initial value problem: Requires the 3-D distribution of aerosol concentration at the start of the forecast: : Assimilation of previous forecast + information from remote sensing of aerosols Current capabilities: Aerosol Optical Depth (AOD; 2-D) (MODIS and MISR) Extinction (3-D) (CALIPSO) AOD
NASA Data for NAAPS Initialization Natural run + Land/Ocean MODIS + Land/Ocean MISR + Ocean MODIS + land/Ocean MISR + Ocean MODIS NAAPS AOD AERONET AOD Multi-sensor assimilation is critical to aerosol assimilation.
Overview of NASA Data Usage in NAAPS NAAPS Component Assimilated Data MODIS and GOES data used to produce gridded smoke emissions (FLAMBE, WF-ABBA) MODIS Dust Enhancement Product and TOMS AI used to identify dust sources NRL Level 3 version of MODIS AOD AERONET and CALIPSO climatology used for speciation R&D: CALIPSO used for 3-d var data assimilation and validation Unused: MODIS Deep Blue, MISR, AVHHR AOD AERONET – AOD, absorption, size CALIPSO and MISR - Altitude FLAMBE– Hourly, global, biomass emission fluxes in real-time and archived since 2000 DSD – Global dust source database NAVDAS-AOD– data assimilation, produces 6-hourly, global 3-d distributions of aerosol species (sulfate, smoke, dust, salt), in real-time and back to 2000 NAAPS Validation
NAAPS Ensemble Forecast of Saharan Dust Transport to the Americas 72h Forecast of Dust AOD, Valid 00Z 10 September, 2011
DataFed and VIEWS: Provide NAAPS Products for Exceptional Event Analysis NAAPS and other data combined for Exceptional Event analysis with EPA and States NAAPS dust AOD indicates transport from Asia over the Pacific Surface aerosol chemical data and back trajectories confirm the Asian origin of dust Time series at any location, time or integrated Vertical profile at any location, time or integrated NAAPS data integrated with visualization and exploration tools and DSS applications.
Key Developments: Partnerships • Washington University - Center for Air Pollution Impact and Trend Analysis (CAPITA) Make available NAAPS analyses to the AQ community via the Federated Data System (DataFed) • Colorado State University: Visibility Information Exchange Web System (VIEWS) run by Cooperative Institute for Research of the Atmosphere (CIRA) NAAPS analyses of dust and smoke that originate outside the U.S. are incorporated in the DSS for implementation of the Regional Haze Rule (RHR) and distributed by VIEWS • National Oceanic and Atmospheric Administration (NOAA) – CIRA, Monitoring of long-range transport of pollution • Texas Commission on Environmental Quality Saharan dust effects on PM in eastern Texas
NAAPS Data Delivery Case: Sahara Dust Impact on Texas Air Quality, 2006 Dust AOD along ship track NAAPS dust AOD Jul 31, 2006 Dust surface concentration Dust surface concentration, vert. profile, AOD along the research ship track Gridded 4D NAAPS for TX-Mex and the ship track regions, May-Sep 2006 A NOAA-TCEQ project needs LRT (NAAPS) for their analysis NOAA data request forwarded to the NAAPS data archive at DataFed The data are extracted and delivered as standard CF-netCDF files
NAAPS Data Delivery Case: Sahara Dust Impact on Texas Air Quality, 2006 Spatial pattern at specified height, time Time series at given height and location Layer Concentration May-Sep 2006 Layer Concentration Surface Concentration May-Sep 2006 Surface Concentration The data extraction domain is defined by the DataFed GUI interface Based on the data extraction, the 4D pattern can be explored The user can then combine the NAAPS data subset with other data In DataFed, NAAPS data can be extracted along multiple dimensions
Key Developments - Metrics • Exceptional events flagging • NAAPS distributed via standard protocol through DataFed for analysis and flagging of Exceptional Events • Background conditions for EPS Regional Haze Rule • Use 10-year NAAPS reanalysis to identify background on 20% best and worst haze days • Use NAAPS sensitivity runs to estimate impact of projected emissions (e.g. HTAP scenarios) • AQ Forecasting and sampling • LRT forecasts distributed • NAAPS made available for boundary conditions for regional models • NAAPS forecasts used to guide measurements in field missions
ARL Review/Description Starting ARL :3 Projected Ending ARL : 7 Reported (Dec 2011) ARL:4 ARL 4 Justification from Estimator: Components of eventual application system brought together and technical integration issues worked out: NAAPS data were transferred to Wash U. on a daily basis. NAAPS post processing code was transferred to WU and implemented there. The native NAAPS data files are transformed to sigma and pressure coordinates. The 6-hourly NAAPS have been accumulated for years 2007-2011 and now accessible through the DataFed browser. Facilities to extract data subsets have also been implemented and tested with several application areas. Organizational challenges and human process issues identified and managed: The NAAPS data products were harmonized with the DataFed service-oriented data system. Interaction between NRL and WashU resolved the issues with formatting, routine data transfer, decoding as well as differences in operating systems. Interaction with users has shown the diversity of user needs for different formats, data subsetting and parameter aggregation. These were resolved by iterative consultation-testing cycles with the users.
ARL cont. Starting ARL :3 Projected Ending ARL : 7 Reported (Dec 2011) ARL:4 Current (08/23/2012) ARL: 7 ∆ (ARL) = 4 ARL 5 Justification from Estimator: Application components integrated into a prototype system: The data products are integrated into DataFed where users can browse, extract subsets and aggregate NAAPS data. The application system's potential to improve the decision-making activity has been determined and articulated (e.g., projected impacts on cost, functionality, delivery time, etc.): The NAAPS data delivery is in real time, service based, so it can be incorporated into decision systems.
ARL cont. ARL 6 Justification from Estimator Prototype application system beta-tested in a simulated operational environment: The NAAPS data in DataFed were tested by users in the US and internationally for exceptional aerosol events and model-observation comparison. Projected improvements in performance of decision-making acitivity demonstrated in a simulated operational environment: The addition of NAAPS has been shown to improve exceptional event analysis and also general aerosol forecasting ARL 7 Justification from Estimator: Prototype application system has been integrated into the end-user's operational environment: NAAPS data were incorporated in the data pool used by AQ forecasters in the Northeastern US. Prototype application's functionality has been tested and demonstrated in decision-making activity: Air quality forecasts are made primarily for informing the Public, who then make decisions on their daily activities.
Obligations and Cost Status PY12 money arrived in April and May 2012. Unused PY11 money at CIRA was lost in their system. This glitch has been fixed, the funds retrieved, and there should be no further issues.
Upcoming Plans • Complete the 10-year data set at the DSS to allow investigation of past events and development of event climatologies. • Demonstrate use of NAAPS as boundary conditions for CMAQ model • Issues/Concerns/Lessons Learned • Users of models have a variety of data needs: latitude, longitude, altitude, parameter, units, etc. Simply providing a standard data package is not adequate. DataFed now allows most of this variety. • Funding problem at CIRA has been solved. Funds will be costed this PY.
Summary • We have applied an operational global aerosol forecasting system to AQ problems. • Developed distribution of NAAPS via existing DSS DataFed and VIEWS. Available back to 2006. • NAAPS data have been delivered to AQ analysts and forecasters. • Suitable for quantifying impact of LRT to CONUS. • Successfully demonstrated as evidence for several exceptional smoke and dust events. • System is operational, data are ported daily and are available for use. • END
Schedule/Milestones AR AR