Download
1 / 28
290 likes | 306 Views
Public Health and Evaluation Applications. Module 10. Overview. Surveillance of Public Health Outcomes. Focusing an Evaluation of System Change Evaluation Tools for Systems Change. Quality Indicators and SPC Public Health Applications.

E N D
Overview • Surveillance of Public Health Outcomes. • Focusing an Evaluation of System Change • Evaluation Tools for Systems Change
Quality Indicators and SPCPublic Health Applications • Improving Health in the Community: A Role for Performance Monitoring • IOM 1997 • Lead states in public health quality improvement: A Multistate Learning Collaborative. Robert Wood Johnson Foundation. • Extensive use of SPC in Patient Safety.
Quality Indicators and SPCPublic Health Applications Hospital Epidemiology is the classical place for SPC in epidemiology.
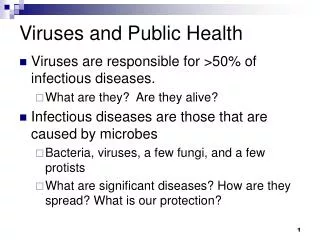
Other Areas with Wide Epidemiological Application • Infectious Disease (outbreak detection) • Syndromic Surveillance • Detection of Bioterrorism
Environmental health and injury prevention can make powerful use of this material.
How to focus an evaluation • Describe purpose • Identify users of evaluation results • Identify questions the evaluation should answer. • Describe methods to answer these questions. • Create agreements on who will do what to evaluate the initiative.
Think-Pair-ShareEvaluating Improvement Initiatives • You have been asked to lead an evaluation team for a national improvement collaborative. • 10 clinics have agreed to empanel their patients to care teams, experiment with small tests of change, and meet together every month to share lessons learned.
Think-Pair-ShareEvaluating Improvement Initiatives • List 3 questions you would want the evaluation to answer. • How would you answer these three questions?
Evaluation Questions for Multi-site Systems Change Interventions • Naïve—Does it work? • Less Naïve—Can it work? • Ideal—What works for whom under what circumstances?
Consequences • Non-linear response • Cannot isolate the effects of the intervention • Depends too much on the changing context in which the intervention occurred
Does this design answer the question:What works for whom under what circumstances?
Richer evaluation design *Qualitative **Quantitative ***Mixed
Even richer evaluation design *Qualitative **Quantitative ***Mixed
Tools for richer and even richer designs • Meta-analysis of before-after or beginning-ending results. • “Dose-Response” • Sensitivity analysis of forest chart. • Regression of outcome on degree of implementation. • Mixed-Method Evaluation • SPC set up for evaluation. • Time Series Analysis
Assessing “Dose-Response” and circumstances that predict success with sensitivity analysis • Plot the forest chart again. • Retain only sites with greater than 50 percent of patients empanelled (or any other variable of interest). • Compare results with original forest chart. • Look at the effect restricting analysis had on the “All Sites” observation.
Assessing “dose-response” with regression Y = α + βx Where: Y = Difference between ending and beginning rates. α = Intercept x = percent of patients empanelled. Β = regression coefficient for x
Assessing “dose-response” with regression Y = α + β1x1 + β2x2 Where: Y = Difference between ending and beginning rates. α = Intercept x1 = percent of patients empanelled. β1 = regression coefficient for x1 x2 = self management support (1=yes, 0=no). β2 = regression coefficient for x2
Mixed Method Evaluation Qualitative (Stories) Quantitative (Statistics)
Mixed Method Evaluation • Quantitative • Assess change before/after. • Compare to control group. • Compare outcome across multiple intervention sites. • Test hypotheses generated by qualitative. • Qualitative (in-depth interviews, groups) • Rich description of implementation • Rich description of context (barriers, facilitators). • Compare high performers with low performers on qualitative results. • Generate hypotheses for differences in performance.
ConcludingQuote from Dr. Don Berwick “Many assessment techniques developed in engineering and used in quality improvement—statistical process control, time series analysis, simulations, and factorial experiments—have more power to inform about mechanisms and contexts than do RCTs, as do ethnography, anthropology, and other qualitative methods. For these specific applications, these methods are not compromises in learning how to improve; they are superior.” Donald Berwick JAMA. 2008;299(10):1182-1184