Download

1 / 0
20 likes | 159 Views
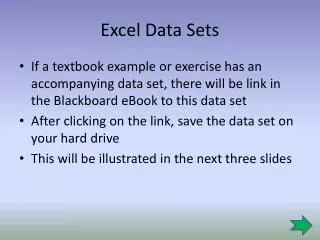
Learn to craft engaging reports from complex data in Excel through FSRC workshops. Access workshop materials at http://www.csus.edu/irt/fsrc/workshops.html and download sample files to enhance your skills.

E N D