Download
1 / 25
300 likes | 537 Views
Data Analysis in Excel. Analysis of Uncertainty. Learning Objectives. Learn to use statistical Excel functions: average, median, min, max, stdev, var, varp, standardize, normdist, norminv, normsinv. RAT 9b. General Excel Behavior. - Analyzes the range of cells you specify

E N D
Data Analysis in Excel Analysis of Uncertainty
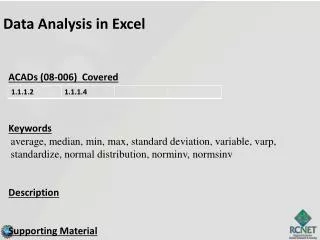
Learning Objectives Learn to use statistical Excel functions: average, median, min, max, stdev, var, varp, standardize, normdist, norminv, normsinv
General Excel Behavior - Analyzes the range of cells you specify - Skips blank cells
Example: =AVERAGE(B72:B81) Mean Sample Population Excel =AVERAGE(cellrange)
Mode Value that occurs most often in discretized data Excel Example: =MODE(cellrange) =MODE(B2:B81) If tie, reports first value in list
Median The middle value in sorted data Excel =MEDIAN(cellrange) Example: =MEDIAN(D2:D81) Note: When using this command, there is no need to sort the data first.
Maximum, Minimum, and Range Excel Example: =MIN(cellrange) =MIN(D2:D81) =MAX(cellrange) =MAX(D2:D81) There is no explicit command to find the range. However, it can be easily calculated. = MAX(D2:D81) - MIN(D2:D81)
Standard Deviation and Variance Population Sample Excel =STDEVP(cellrange) =STDEV(cellrange) =VARP(cellrange) =VAR(cellrange) Variance = s2 Variance = s2
Example - Exam Grades • Data set: grades.xls 78 students, 1 did not take exam • Verify the following: Mean is 79.41 Mode is 79 - occurs 6 times Median is 79.5 • median close to mean suggests no major outliers • Remember, student who did not take exam is not included in data More
Example Cont. • Verify max is 99 min is 60 Range is 99-60 = 39 Population variance is 60.7 Population std. dev. is 7.79
Team Exercise - 15 min • Collect ages (in months) of team members and members of teams around you (at least 15 values) • Enter as a column in Excel • Compute mean, mode, median, max, min, range, sample variance and std. dev. using Excel commands
mean Review:The Normal Distribution The normal distribution is sometimes called the “Gauss” curve. RF Relative Frequency x
Review: Standard Normal Distribution Define: Then Area = 1.00 z
Z-transform Excel =STANDARDIZE(x,mean,stddev) Example: =STANDARDIZE(85,75,10) gives 1.0
Standard Normal Cumulative Distribution area from minus infinity to z NOT 0 to z, like Z-table Excel Example: =NORMSDIST(z) =NORMSDIST(1.0) =0.8413
Normal Data in Excel To avoid Z transform, use: =NORMDIST(x,mean,stddev,true) Example =NORMDIST(85,75,10,true) = 0.8413
Excel Example Normal distribution with =5, =0.2 Find area from 4.8 to 5.4 • Solution 1: =STANDARDIZE(4.8,5,0.2) Gives -1 =STANDARDIZE(5.4,5,0.2) Gives 2 =NORMSDIST(2)-NORMSDIST(-1) = 0.8186 • Solution 2: =NORMDIST(5.4,5,0.2,TRUE)- NORMDIST(4.8,5,0.2,TRUE) = 0.8186
Inverse Problem Given , and probability, find x =NORMINV(prob,mean,stddev) Given probability, find z =NORMSINV(prob) Note: The probability is the area under the curve from minus infinity to x (or z)
Inverse Problem:Example 1 A batch of bolts have length =5.00 mm, =0.20 mm. 99% of the bolts are shorter than what length? • Solution 1: =NORMINV(0.99,5,0.2) gives 5.47 mm • Solution 2: =NORMSINV(0.99) = 2.33 5.00+0.20*2.33 = 5.47 mm
Inverse Problem:Example 2 A batch of bolts have length =5.00 mm, =0.20 mm. The bolt length is specified as 5.00 mm ± tolerance. What is the value of the tolerance such that 99% of the bolts are encompassed? Solution: =NORMINV(0.995,5,0.2) = 5.52 mm =NORMINV(0.005,5,0.2) = 4.48 mm Tolerance = 5.52 - 5.00 = 0.52 mm Note: It is symmetrical; therefore 0.5% on either side
Team Exercise The clock frequency of a batch of Intel microprocessors was measured to be a normal distribution with =475 MHz, =50 MHz. What fraction of processors can be sold in each category? >600 MHz 400 - 450 MHz 550 - 600 MHz 350 - 400 MHz 500 - 550 MHz < 350 MHz 450 - 500 MHz
Think-Pair-Share In the next 1 minute, as an individual list three specific things that you don’t understand about today’s topic Now take 2 minutes to merge your list with the person sitting next to you AND add 1 new item to the list In the next 5 minutes share the results with the other half of your team, delete questions that you can answer for each other, AND prioritize the remaining questions your list