Download
1 / 18
180 likes | 251 Views
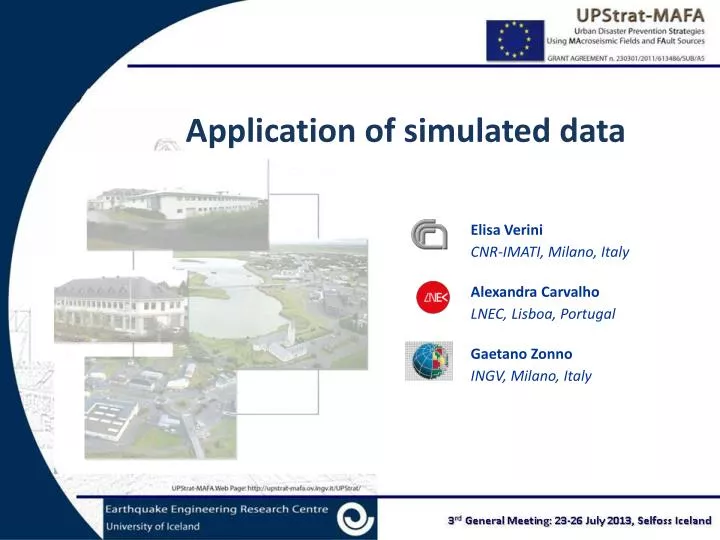
Application of simulated data. Elisa Verini CNR-IMATI, Milano, Italy Alexandra Carvalho LNEC, Lisboa, Portugal Gaetano Zonno INGV, Milano, Italy. Lopes, 2008 Fonte: IM, 1983. Kaka & Atkinson (2004). Felt. Forecast. MMI. PGV. 37 soil profiles. 37. 3. Site effects

E N D
Application of simulated data Elisa Verini CNR-IMATI, Milano, Italy Alexandra Carvalho LNEC, Lisboa, Portugal GaetanoZonno INGV, Milano, Italy
Kaka & Atkinson (2004) Felt Forecast MMI PGV
37 3
Site effects • Soildynamicamplification Sa [g] 1.2 1 0.8 0.6 0.4 0.2 0 0 5 10 15 20 25 Sd [cm]
PGV – Seismic input at bedrock level PGV – Surface seismic motion
Kaka & Atkinson (2004) Felt Forecast MMI PGV
Felt Forecast
Forecast Atkinson & Kaka (2007) MMI PGV
Stochastic methodology applied to the definition of MCE Upper crustal attenuation Geometric attenuation Inelastic attenuation O data: 21 distances x 8 azimuths x 18 magnitudes x 15 x 15 simulations= 45360 spectra
Application of simulated data Elisa Verini CNR-IMATI, Milano, Italy Alexandra Carvalho LNEC, Lisboa, Portugal GaetanoZonno INGV, Milano, Italy