Download

1 / 15
150 likes | 250 Views
Haishan Liu. Mapping across ERP Patterns from Simulated Data. Goal. t o identify correspondences (“mappings”) between ERP patterns derived from: different data decomposition methods (temporal PCA and spatial ICA) different spatial and temporal metrics that are used to summarize data

E N D
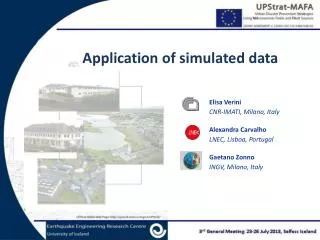
Haishan Liu Mapping across ERP Patterns from Simulated Data
Goal • to identify correspondences (“mappings”) between ERP patterns derived from: • different data decomposition methods (temporal PCA and spatial ICA) • different spatial and temporal metrics that are used to summarize data • different subject groups
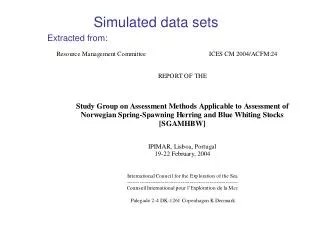
Dataset – 2 x 2 x 2 Factorial Design for 8 simulated ERP datasets • SG01/SG02 refer to subject groups #1 and #2, respectively. • tPCAand sICA are distinct methods for transforming data into discrete, rank-1, spatiotemporal patterns • Metric Sets 1-2 are alternative sets of spatial/temporal attributes to summarize the simulated ERP patterns
Method - Overview • Detecting structural dissimilarity • To incorporate distribution information of data points along each attribute. • Comparing non-overlapping clusterings • To compare clusterings which do not share any common data points.
Density Profile • density of an attribute-bin region for cluster ck in clustering C • densC(k, i, j): the number of points in the region (i, j), which belongs to the cluster ckof clustering C.
Density Profile • density profile of clustering C • VC = (densC(1, 1, 1), densC(1, 1, 2), .., densC(1, 1,Q), densC(1, 2, 1), .., densC(1,R,Q), densC(2, 1, 1), .., densC(K,R,Q))
Density Profile • VC= (8, 0, 5, 3, 0, 6, 3, 3) • VC′ = (5, 2, 2, 5, 3, 4, 6, 1)
Degree of Similarity between Clusterings • VC = (8, 0, 5, 3, 0, 6, 3, 3) • VC′ = (5, 2, 2, 5, 3, 4, 6, 1) Sim(C, C’) = Vc ·Vc’ = 110 c1 c2 c’1 c’2
Degree of Similarity between Clusterings • VC = (8, 0, 5, 3, 0, 6, 3, 3) • VC′ = (5, 2, 2, 5, 3, 4, 6, 1) • VC= (8, 0, 5, 3, 0, 6, 3, 3) • VC′ = (3, 4, 6, 1,5, 2, 2, 5) Sim(C, C’) = Vc ·Vc’ = 110 c1 c2 c’1 c’2 c1 c2 Sim(C, C’) = Vc ·Vc’ = 90 c’2 c’1
Degree of Similarity between Clusterings • VC = (8, 0, 5, 3, 0, 6, 3, 3) • VC′ = (5, 2, 2, 5, 3, 4, 6, 1) • VC= (8, 0, 5, 3, 0, 6, 3, 3) • VC′ = (3, 4, 6, 1,5, 2, 2, 5) Sim(C, C’) = Vc ·Vc’ = 110 = 65 + 45 c1 c2 c’1 c’2 c1 c2 Sim(C, C’) = Vc ·Vc’ = 90 = 57 + 33 c’2 c’1
Degree of Similarity between Clusterings • VC = (8, 0, 5, 3, 0, 6, 3, 3) • VC′ = (5, 2, 2, 5, 3, 4, 6, 1) • VC= (8, 0, 5, 3, 0, 6, 3, 3) • VC′ = (3, 4, 6, 1,5, 2, 2, 5) Sim(C, C’) = Vc ·Vc’ = 110 = 65 + 45 c1 c2 c’1 c’2 ADCO(C, C’) = 110 / max(|Vc|,|Vc’|) = 110 / max(152, 120)=0.724 c1 c2 Sim(C, C’) = Vc ·Vc’ = 90 = 57 + 33 c’2 c’1
Degree of Similarity between Clusterings SG01_tPCA_m1 SG02_tPCA_m1 ADCO: 0.667 Can be solved by the Hungarian Method. Time complexity O(n3).
Experiment Result Difference in only DM (decomposition method) Difference DM and SG (subject group) Difference DM and MS (metric set) Difference in DM and SG and MS