Download
1 / 27
270 likes | 426 Views
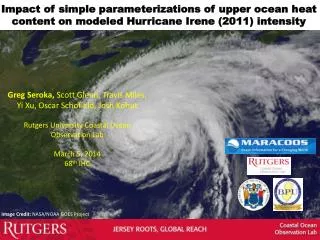
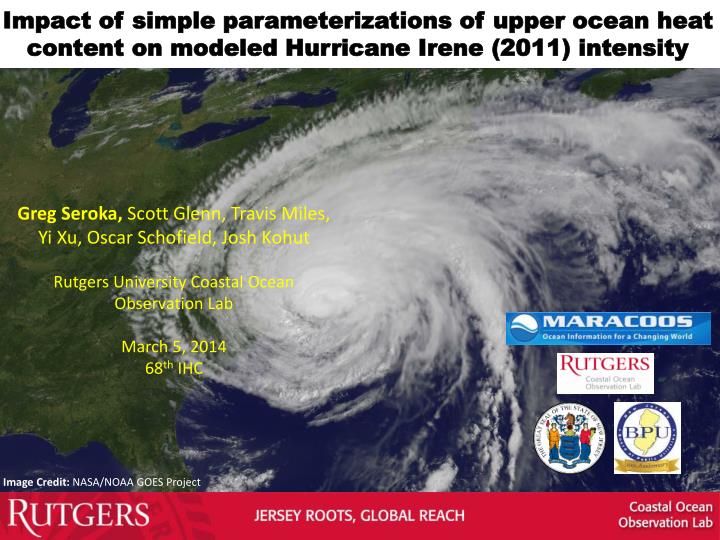
Impact of simple parameterizations of upper ocean heat content on modeled Hurricane Irene (2011) intensity. Greg Seroka, Scott Glenn, Travis Miles, Yi Xu, Oscar Schofield, Josh Kohut Rutgers University Coastal Ocean Observation Lab March 5, 2014 68 th IHC.

E N D
Impact of simple parameterizations of upper ocean heat content on modeled Hurricane Irene (2011) intensity Greg Seroka, Scott Glenn, Travis Miles, Yi Xu, Oscar Schofield, Josh Kohut Rutgers University Coastal Ocean Observation Lab March 5, 2014 68th IHC Image Credit: NASA/NOAA GOES Project
Motivation • In August 2011, Hurricane Irene’s intensity was over-predicted by several hurricane models and over-forecast by the National Hurricane Center (NHC) • NHC final report on Irene: • Consistent high bias in official intensity forecasts • Incomplete eyewall replacement cycle in light wind shear and over warm South Atlantic Bight waters • High bias in operational analysis of intensity • Deep central pressure, strong flight-level winds but low surface winds
Governing factors of hurricane intensity dry air intrusion Question: Did the upper ocean thermal structure and evolution (i.e. evolution of sea surface temperature, SST) contribute to Irene’s intensity over-prediction? vertical wind shear upper ocean thermal structure and evolution hurricane track After Emanuel et al. (2004)
Hypothesis • We hypothesize that the models handled well: • hurricane track (use best boundary conditions); 06Z 10Z
5 Hypothesis • We hypothesize that the models handled well: • hurricane track (use best boundary conditions); • vertical wind shear (TBD); • dry air intrusion (TBD); GOES 13 Channel 3 00Z 09Z
6 Hypothesis • We hypothesize that the models handled well: • hurricane track (use best boundary conditions); • vertical wind shear (TBD); • dry air intrusion (TBD); • Some possible reasons: • Models have improved considerably on predicting tracks • Atmosphere tends to receive more attention in modeling • Models resolve large-scale processes fairly well • But models handled poorly: • upper ocean thermal structure and evolution • This talk aims to show the relative importance of ocean prediction for intensity forecasting of Hurricane Irene
7 Methods – Observations and Model RU16 Glider: at 40m isobath, right of eye track Satellite (“Rutgers SST”): 1km AVHRR 3-day coldest dark pixel SSTcomposite (preserve cold wake); NASA SPoRT 2km SST for cloudy gaps Model: 6km WRF-ARW, boundary conditions to get track correct (important because close to coast); no data assimilation Full RU16 Glider Track Irene RU16 Glider Track 40m isobath 200m isobath (shelf break)
Results • Glider data revealed that ocean mixing and resulting surface cooling preceded the passage of the eye • Improved satellite SST product revealed that this surface ocean cooling was not captured by: • Basic satellite products • Ocean models used for forecasting hurricane intensity • Over 100 sensitivity tests showed that Hurricane Irene intensity is very sensitive to this “ahead-of-eye” SST cooling
1. Glider revealed “ahead-of-eye” cooling warm SSTs before storm passage of eye T (°C) thermocline top Ocean column mixing from leading storm winds cools surface onshore surface currents thermocline bottom offshore bottom currents
2. Improved satellite SST product revealed that this cooling was not captured by: basic satellite product ocean models used for forecasting hurricane intensity RTG HR SST NAM model HWRF-POM low res HWRF-HYCOM medium res Rutgers SST BEFORE IRENE AFTER IRENE
2. However, cooling was captured by high res ocean models Rutgers composite showed that cooler SSTs are captured relatively well by high res coastal ocean models not specifically used for forecasting hurricanes Rutgers SST ROMS ESPreSSO BEFORE RIGHT AFTER AFTER
3. >100 sensitivity tests showed Irene intensity very sensitive to this “ahead-of-eye” SST cooling Over Mid-Atlantic Bight& NY Harbor NJ landfall NHC Best Track Warm pre-storm SST, WRF isftcflx=2 Warm pre-storm SST, isftcflx=1 Warm pre-storm SST, isftcflx=0 Cold post-storm SST, isftcflx=2 Cold post-storm SST, isftcflx=1 Cold post-storm SST, isftcflx=0 Sensitivity to SST(warm minus cold), isftcflx=2 Sensitivity to air-sea flux parameterization (isftcflx=1 minus isftcflx=0), warm SST Sensitivity to air-sea flux parameterization (isftcflx=1 minus isftcflx=0), cold SST
Conclusions • Large majority of SST cooling occurred ahead of Irene’s eye • Glider observed coastal downwelling, which resulted in shear across thermocline, turbulence/entrainment, and finally surface cooling • We determined max impact of this cooling on storm intensity (fixed cold vs. fixed warm SST) • One of the largest among tested model parameters • Some surface cooling occurred during/after eye passage • Actual impact of SST cooling on storm intensity may be slightly lower • A 1D ocean model cannot capture 3D coastal ocean processes resulting in important “ahead-of-eye” SST cooling • A 3D high res ocean model (e.g. ROMS) nested in a synoptic ocean model could add significant value to tropical cyclone (TC) prediction in the coastal ocean—the last hours before landfall
Future work • Improve model spin-up issues • Validate wind shear and dry air intrusion • Evaluate storm size and structure • Compare modeled to observed heat fluxes (need air T, SST) • Move towards accurate fully coupled WRF-ROMS system • WRF w/ hourly ROMS SST • WRF coupled w/ 3D Price-Weller-Pinkel ocean model • WRF-ROMS • More case studies to quantify value of 3D ocean prediction to TC intensity forecasting, eventually across season(s)
Glider, buoy, and HF radar obs. At surface Below surface
Cross-shelf Transects HWRF-POM Before HWRF-HYCOM Before ROMS ESPreSSO Before HWRF-POM After HWRF-HYCOM After Observed bathymetry from NOAA National Geophysical Data Center, U.S. Coastal Relief Model, Retrieved date goes here, http://www.ngdc.noaa.gov/mgg/coastal/crm.html
Explanation of Air-Sea Flux Changes in WRF • τ = -ρu*2 = -ρCDU2 momentum flux (τ) • H = -ρcpu*θ* = -(ρcp)CHUΔθ sensible heat flux (H) • E = -ρLνu*q* = -(ρLν)CQUΔq latent heat flux (E) • ρ: density of air • (u*,θ*,q*): friction velocity, surface layer temperature and moisture scales • U: 10m wind speed • cp: specific heat capacity of air, Lν: enthalpy of vaporization • Δ(θ,q): temperature, water vapor difference between zref=10m and z=sfcIn neutrally stable surface layer within TC eyewall (e.g. Powell et al. 2003): • CD = k2/[ln(zref ⁄ z0)]2 drag coefficient • CH = (CD½ ) X [k/ln(zref ⁄ zT)] sensible heat coefficient • CQ = (CD½ ) X [k/ln(zref ⁄ zQ)] latent heat coefficient • Ck = CH + CQ moist enthalpy coefficient • k: von Kármán constant • zref: (usually 10m) reference height Our Changes in SST: Δθ = θ(2 or 10m) – θsfc (θ∝T) Δq = q(2 or 10m) – qsfc ∴Δ(SST)ΔθsfcΔθΔH(sensible heat flux) Δ(SST)(indirectly)ΔqsfcΔqΔE(latent heat flux) Ka= 2.4E-5 m2s-1 (background molecular viscosity) Re* = u*Z0 ⁄ν (Roughness Reynolds number), Pr = 0.71 (Prandtl number), Sc = 0.6 (Schmidt number) After Green & Zhang (2013)
Plot of Resulting Exchange Coefficients After Zhang et al. (2012) Presentation for HFIP
1D ocean model H0ML = 10m Gamma = 1.6C/m 1D ocean model H0ML from HYCOM Gamma = 1.6C/m
Sensitivity tables: 110 runs Bad B.C. Bad forecast of wind Max wind largest sensitivity to SST Parameterized Upper Ocean Heat Content Diff. init. time Bad B.C. Bad forecast of pressure Min SLP large sensitivity to SST
Simple Uncoupled WRF Hindcast Sensitivities:SST Setup • Modify SST input to “simulate” SST cooling: • From fixed warm pre-storm SST (e.g. NAM, GFS) to what? • 2 methods to determine optimal timing of SST cooling: • When did models show mixing in southern MAB? • When did “critical mixing” wind speed occur in southern MAB? (Critical mixing w.s. = w.s. observed at buoys and modeled at gliderwhen sea surface cooled). Assumessimilar stratification across MAB. • Cooling Time = 8/27 ~10:00 UTC • Model Init. Time = 8/27 06:00 UTC • ∴ Used fixed cold post-storm SST
Model Validation Ray et al. (2006) • Height 9.08m (obs) vs. 10m (WRF) [log law] • Averaging time 2-min (land stations)*, 8-min (buoys) vs. instantaneous (WRF) [obs gusts] • Validate at 44014, 44009, 44065, and tall met towers (for boundary layer shear profile- NHC indicated it as large during Irene) *OYC: 15-min, Stafford Park: 10- and 60-min