Download
1 / 38
380 likes | 596 Views
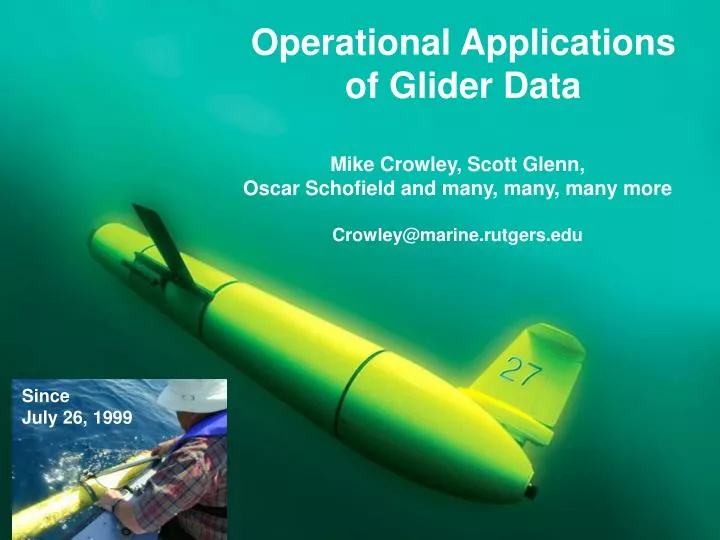
Operational Applications of Glider Data. Mike Crowley, Scott Glenn, Oscar Schofield and many, many, many more Crowley@marine.rutgers.edu. Since July 26, 1999. Overview of Gliders in Action. Modeling (ocean and Atmosphere) Education Capturing episodic events Water Quality

E N D
Operational Applications of Glider Data Mike Crowley, Scott Glenn, Oscar Schofield and many, many, many more Crowley@marine.rutgers.edu Since July 26, 1999
Overview of Gliders in Action Modeling (ocean and Atmosphere) Education Capturing episodic events Water Quality Long term trends, climate change Fisheries/habitat: Modeling, acoustic tagging HABS Search and Rescue Chemistry (Ph) MORE!
Gliders in Modeling(Physics)Note there are modeling examples throughout talk
Model Tuning Large amount of in situ data allowed tuning of MODAS to better resolve relevant oceanographic features than ever before. Sargasso Sea Front Sargasso Sea Front Sargasso Sea Front Cold Core Eddy Warm Core Remnant Warm Core Remnant Warm Core Remnant Cold Core Eddy Cold Core Eddy • Standard Parameters • Satellite data only • Loosely defined Sargasso Sea Front. • Weak, misplaced cold core eddy. • Nonexistent warm core remnant. • Weak current velocities. • Standard Parameters • Satellite and in-situ data • Increased detail in Sargasso Sea Front. • Weak, correctly placed cold core eddy. • Weak warm core remnant. • Stronger current velocities. • Tuned Parameters. • Satellite and in-situ data. • Undulating detail in Sargasso Sea Front. • Strong, correctly placed cold core eddy. • Turbulent warm core remnant. • Strongest current velocities.
Gliders in Education • Informal Educators • K-12 • Community College/2-yr programs • Undergrad/4-yr • Graduate • Workforce • International “The distinct line between research and education is gone – It is now just a broader, continuous spectrum of activity”
Trans-Atlantic Education Social networking tools developed to enable collaboration between scientists and students in the U.S., Canada, Spain and Portugal on the RU15, RU17, and RU27 long-duration glider missions. Interactive Data Interface Google Earth, Glider GUI Briefing Blog Web Portal
What do the students get out of this? • Experience Multimodal Multiplatform Science • Numerous speaking opportunities – Learn to Communicate. • Research on their Resume. • Leads to Summer Internships – National & International. • Leads to Graduate School Acceptances. • Leads to Job Offers from Glider Operations Centers. • Leads to higher rankings in the environmental job market. • Meet national and international leaders in oceanography. • Develop friendships that persist across space and time. • They return to tell others of the importance of this experience.
OOI: EPE Glider Tools Focus: Building tools for educators to use in the introductory undergraduate classroom
Ecological Decision Support – Fisheries + Like Upwelling Our Approach: Develop statistical models using bottom trawl surveys and MARACOOS 3-D data to predict species distribution based on observed or forecasted MARACOOS 3-D fields. Hate Downwelling Downwelling Upwelling Downwelling Upwelling
Receiver Integrated Glider • Mobile tracking of offshore environments • Reach currently unmonitored areas • Natural addition to ongoing research • Increase understanding of fisheries interactions • Enables coupling of data sets • Telemetry data • Temperature • Salinity • Productivity • Moves us beyond fixed arrays
Deepwater Horizon Oil Spill: Coordinated Rapid Response Contributed Assets: HF Radar Networks USF, USM Gliders iRobot, Mote, Rutgers, SIO, UDel, USF, Navy Drifters & Profilers Horizon Marine, Navy Satellite Imagery CSTARS, UDel, Rutgers Ocean Forecasts Navy, NCSU Data/Web Services ASA, Rutgers, SIO USM HFR TS Bonnie USF HFR USM HFR validation of SABGOM Forecast in region with satellite detected oil slicks
Glider Data in the spill area: An interesting discovery 0 500 1000 0 500 1000 Depth (m) Depth (m) CDOM Fluorometer 0 500 1000 0 500 1000 Depth (m) Depth (m) Oxygen Red Scatter
Composite of Satellite Observed Oil Spill Locations Feedback from the Deepwater Horizon Incident Command Center “All - Greetings from Unified Area Command in New Orleans. I couldn't agree more - the IOOS community has acquitted itself very well during this entire incident. Not only has everyone provided valuable information - you have done it without getting in the way of the ongoing operations. It's been a pleasure to represent IOOS here and see all the great contributions from the larger IOOS community. “ - Sam Walker (IOOS representative to Deepwater Horizon Unified Command Center), June 18, 2010 We did not get in the way “… AWESOME JOB - that call that we had last week was a very good thing. You are taking a huge burden off of the team here who is trying to simply capture the deluge of assets now being deployed. “ - Sam Walker (IOOS representative to Deepwater Horizon Unified Command Center), July 2, 2010 We reduced the burden “…Thanks to everyone for all of your efforts to support the Response and the very professional and competent manner in which you have executed your efforts. IOOS has played a huge role in informing the modeling teams and the Unified Command through your extraordinary service. “ - Sam Walker (IOOS representative to Deepwater Horizon Unified Command Center), August 6, 2010 We informed modeling teams & leadership
Tracking Hurricane Irene Temperature
Atmospheric Model Run Comparison WARM (RTG only) COLD “Update” (AVHRR)
NJ Water Quality Deployments August 2010 Temperature Temperature November 2010
Water Quality – Low DO – July 2012 Salinity Temp Density O2
TWR Slocum Gliders in the study of the harmful alga, Karenia brevis, on the WFS since January 2003
USCG: Search & Rescue Optimal Planning System SAROPS We have already proven the utility of HF-RADAR for SAR SAROPS 96-Hour Search Area:HF Radar= 12,000 km2 SAROPS 96-Hour Search Area: HYCOM = 36,000 km2 What About Gliders? Surface Temps Currents
Long Term Studies in Southern California Hovmoller: Temp anomaly at 50 m • SoCal vs. Equatorial Niño Index • An atmospheric teleconnection between the equator and the California Current System? La Niña El Niño • Offshore 200 km: Westward prop. consistent with Rossby waves. • Inshore 200 km: Temp covaries with Equatorial Niño
The Future • PH Sensors, ISUS • Require high end cal • Biological Sampling filters • Other Items
Summary Modeling (ocean and Atmosphere) Education Capturing episodic events Water Quality Long term trends, climate change Fisheries/habitat: Modeling, acoustic tagging HABS Search and Rescue Chemistry (Ph) MORE!
Offshore Applications -Science drivers: What are limits of environmental predictability? How does the environmental variability drive the acoustic uncertainties? • Anti Submarine Warfare Eddies: Sargasso Sea Spring and Summer 2005
Regional Observatory - Mid-Atlantic Global Observatory Remote Observatory - Antarctic
Time History of Mixing During Irene: Profiles of the Standard Deviation Vertical Velocity Profile Eddy viscosity Linear * Exponential Decay Linear Time Progresses from Red to Blue
Hurricane Irene Hurricane Irene 0 26 depth temperature 14 55 0 33 depth salinity 29 55 0 105 depth % oxygen 55 60 date 8/12 9/07
Water Quality – Tracking Hurricane Irene Similar event 2 weeks ago 2 4 6 8 2 4 6 8 Dissolved Oxygen (mg/L)
Westward propagation in glider data and model Glider • Anomalies in alongshore velocity propagate westward along line 90 offshore of the Santa Rosa Ridge • Phase speed is consistent with first mode baroclinic Rossby wave • Propagation not apparent along line 80 in observations, but is strong in model Model The model assimilated glider T and S, but did not assimilate glider velocity. 80 90