Download
1 / 21
210 likes | 355 Views
OHD/HL Distributed Hydrologic Modeling. Pedro Restrepo Hydrology Group HIC Conference Jan. 24-27, 2006. Goal. R&D for improved products and services: RFC Operations WFO Flash Flood Prediction NOAA Water Resources Program. R&D Topics.

E N D
OHD/HL Distributed Hydrologic Modeling Pedro Restrepo Hydrology Group HIC Conference Jan. 24-27, 2006
Goal • R&D for improved products and services: • RFC Operations • WFO Flash Flood Prediction • NOAA Water Resources Program
R&D Topics • Prototype Water Resources products (e.g. soil moisture) • Parameterization/calibration (with U. Arizona and Penn State U.) • Flash Flood Modeling: statistical distributed model • Impacts of spatial variability of precipitation • Data assimilation • Snow (Snow-17 and energy budget models in HL-RDHM) • Spatial and temporal scale issues • Data issues • Links to FLDWAV
NOAA Water Resources Program:Prototype Products • Initial efforts focus on soil moisture HL-RDHM soil moisture for April 5m 2002 12z Soil moisture (m3/m3)
UZFWC UZFWC UZTWC UZTWC LZFPC LZFPC LZFSC LZFSC LZTWC LZTWC Modified Sacramento Soil Moisture Accounting Model Modified Sacramento Soil Moisture Accounting Model In each grid and in each time step, transform conceptual soil water content to physically-based water content Physically-based Soil Layers and Soil Moisture Sacramento Model Storages Sacramento Model Storages SMC1 SMC2 SMC3 Gridded precipitation, temperature SMC4 SMC5 CONUS scale 4km gridded soil moisture products using SAC and Snow-17
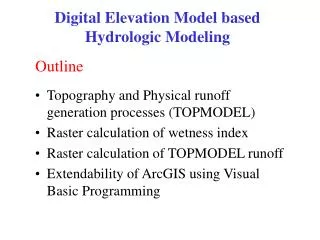
Distributed ModelParameterization-Calibration • Explore SSURGO fine scale soils data for initial SAC model parameters (deliverable: parameter data sets in CAP) • Investigate auto-calibration techniques • HL: Simplified Line Search with Koren’s initial SAC estimates. • U. Arizona: Multi-objective techniques with HL-RDHM and Koren’s initial SAC parameters. • Continue expert-manual calibration • Evaluate gridded values of Snow-17 parameters
Distributed Model Parameterization Use of SSURGO Data for SAC Parameter Derivation SSURGO data has show improvements in certain cases; more work is needed Hydrograph Comparison __ Observed flow __SSURGO-based __STATSGO-based
A Statistical-Distributed Model for Flash Flood Forecasting at Ungauged Locations Real-time QPE/QPF simulated historical peaks (Qsp) Archived QPE Initial hydro model states Real-time Historical • Why a frequency- based approach? • Frequency grids provide a well-understood historical context for characterizing flood severity; values relate to engineering design criteria for culverts, detention ponds, etc. • Computation of frequencies using model-based statistical distributions can inherently correct for model biases Distributed hydrologic model (HL-RDHM) Distributed hydrologic model (HL-RDHM) Max forecasted peaks Statistical Post-processor Simulated peaks distribution (Qsp) (unique for each cell) Forecasted frequencies
Statistical Distributed Flash Flood Modeling- Example Forecasted Frequency Grids Available at 4 Times on 1/4/1998 15 UTC 14 UTC In these examples, frequencies are derived from routed flows, demonstrating the capability to forecast floods in locations downstream of where the rainfall occurred. 17 UTC 16 UTC
Simulated Observed Method to Calculate “Adjusted” Peaks • Probability matching was used to compute adjusted flows at validation points. • For implementation we can only assume a similar implicit correction if we are considering frequency-based flood thresholds at ungauged locations. 157 cms (simulated) 247 cms (adjusted)
Statistical Distributed Flash Flood Modeling -Example Forecast Grid and Corresponding Forecast Hydrographs for 1/4/1998 15z Eldon (795 km2) ~11 hr lead time Implicit statistical adjustment ~1 hr lead time Dutch (105 km2)
Distributed Model Intercomparison Project (DMIP) Nevada Missouri Kansas American River Elk River Carson River Illinois River Oklahoma Arkansas California Blue River Texas Phase 2 Scope HMT • Tests with Complex Hydrology • Snow, Rain/snow events • Soil Moisture • Lumped and Distributed • Data Requirements in West • Additional Tests in DMIP 1 Basins • Routing • Soil Moisture • Lumped and Distributed • Prediction Mode
DMIP 2 Science Questions • Confirm basic DMIP 1 conclusions with a longer validation period and more test basins • Improve our understanding of distributed model accuracy for small, interior point simulations: flash flood scenarios • Evaluate new forcing data sets (e.g., HMT) • Evaluate the performance of distributed models in prediction mode • Use available soil moisture data to evaluate the physics of distributed models • Improve our understanding of the way routing schemes contribute to the success of distributed models • Continue to gain insights into the interplay among spatial variability in rainfall, physiographic features, and basin response, specifically in mountainous basins • Improve our understanding of scale issues in mountainous area hydrology • Improve our ability to characterize simulation and forecast uncertainty in different hydrologic regimes • Investigate data density/quality needs in mountainous areas
Basic DMIP 2 Schedule • Feb. 1, 2006: all data for OK basins available • July 1, 2006: all basic data for western basins available • Feb 1, 2007: OK simulations due from participants • July 1, 2007: basic simulations for western basins due from participants
Witold Krajewski Praveen Kumar Mario DiLuzio, Jeff Arnold Sandra Garcia (Spain) Eldho T. Iype (India) John McHenry Konstantine Georgakakos Ken Mitchell (NCEP) Hilaire F. De Smedt (Belgium) HL Thian Gan, (Can.) Newsha Ajami (Soroosh) Vazken Andreassian (Fra) George Leavesley (USGS) Kuniyoshi Takeuchi (Japan) Baxter Vieux John England (USBR) Dave Garen, Dennis Lettenmaier Martyn Clarke DMIP 2: Potential Participants
DMIP 2 Website • http://www.nws.noaa.gov/oh/hrl/dmip/2/index.html
Impact of Spatial Variability • Question: how much spatial variability in precipitation and basin features is needed to warrant use of a distributed model? • Goal: provide guidance/tools to RFCs to help guide implementation of distributed models, i.e., which basins will show most ‘bang for the buck’? • HOSIP documents in preparation
Impact of Precipitation Spatial Variability precipitation at time t +Dt precipitation at time t ‘filter’ input precipitation at time t + 2Dt flow output time
Data Assimilation • Strategy based on Variational Assimilation developed and tested for lumped SAC model • HOSIP documents in preparation
Distributed Snow-17 • Strategy: use distributed Snow-17 as a step in the migration to energy budget modeling: what can we learn? • Snow-17now in HL-RDHM • Tested in MARFC area and over CONUS • Further testing in DMIP 2 • Gridded Snow-17 parameters for CONUS under review. • Related work: data needs for energy budget snow models
Thank You! North Fork Dam, American River, California. Used with permission