Download
1 / 32
400 likes | 776 Views
Hydrologic Measurement Techniques. Introduction to Hydrologic Data Collection Fritz R. Fiedler. Hydrologic Data Collection. Why do we collect hydrologic data? What forms do the data take? What do we do with the data? How are the data “handled”?. Why? Many, many reasons!.

E N D
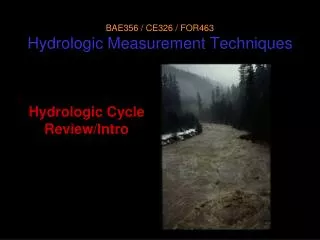
Hydrologic Measurement Techniques Introduction to Hydrologic Data Collection Fritz R. Fiedler
Hydrologic Data Collection • Why do we collect hydrologic data? • What forms do the data take? • What do we do with the data? • How are the data “handled”?
Why? Many, many reasons! • Hydrology linked to ecology, e.g., fish habitat (Congress has defined essential fish habitat for federally managed fish species as "those waters and substrate necessary to fish for spawning, breeding, feeding, or growth to maturity.”)
Why continued… • Watershed management
Why continued... • Hydrology linked to water quality…
Why continued... • Hydrology and natural disasters, e.g., flooding
Why continued... • Hydrology and water resources, e.g., Moscow water supply
Why continued... • Hydrology plays an essential role in regional and global climate systems
Why continued... • Life on other planets??
Why - summary • Type of data collected is in part dictated by some purpose • Purpose in this class? • To learn about hydrologic processes in natural systems which, in turn, assist us in development of conceptual and mathematical descriptions of hydrology • To use in developed models
What forms do data take? • Hydrologic processes vary in time and space at different scales, e.g., precipitation
Forms of data continued • Time series data: any variable vs. time
Forms... • Spatial data: variables distributed in space
Exercise • With a partner (or two), identify time and space scales important to each of the following with respect to precipitation: • Fish habitat in the Columbia River System • Hydrologic changes in response to logging • Flooding in the Mississippi River • Moscow water supply • Climate change
Time Scales: minute hour day month seasonal year decade century Space Scales foot 100 feet mile 10 miles 100 miles 1000 miles 10000 miles Exercise hints
What do we do with the data? • Statistical Analysis (learn about natural system behavior) • temporal • spatial • Modeling • steady-state vs. transient • lumped vs. distributed
Statistical Analysis • Temporal Mean (a.k.a. average) • average annual rainfall • mean daily streamflow • Spatial Mean • mean areal precipitation
Time Series Sampling • If observations are taken at a frequency (number/time period) of f,then any information with a frequency greater than 1/2f can not be recovered. • If you take temperature measurements every 24 hours, can you learn anything about diurnal variations? • Does this concept apply to spatial sampling?
Precision and Accuracy • Precision: how close the measurements are to each other • Accuracy: how close the measurements are to the true value
Hydrologic Modeling • Steady-State models • may require temporal mean data • may or may not be spatially averaged • Transient models • requires data that vary in time • may or may not be spatially averaged
Hydrologic Modeling • Lumped: spatially averaged • Distributed: variables vary in space input output Model
How are data handled? • Hydrologic Measurement Sequence • sensing: translates intensity of phenomenon into signal • recording: preserves signal • transmission: move recorded signal to central location • translation: convert recorded signal into usable (electronic) form
Data handling continued... • editing: quality control procedures • storage: archive data in some form of database • retrieval: obtain data from storage • More on this in a later class...
Some Practical Aspects • What to bring to field/lab exercises? • proper clothes (is it going to rain?) • boots or other suitable shoes • sun protection • bug protection • notepaper (waterproof?), pen/pencil(s) • watch • calculator
More Practical Aspects • What to record in addition to the actual data? • date, time, general location of measurements • project (lab) name and number • personnel on site (partner, contractor, instructor) • weather conditions • type of equipment used • type and purpose of measurements • measurement number, precise measurement locations
Still More Practical Aspects • Data Organization and Formatting • a “header” that describes the data should precede the data themselves (metadata). • Time series example: $ IDENTIFIER=PTPX-31-1055 DESCRIPTION=BREVARD, NC $ PERIOD OF RECORD=10/1959 THRU 09/1962 $ SYMBOL FOR MISSING DATA=-999.00 SYMBOL FOR ACCUMULATED DATA=-998.00 $ TYPE=PTPX UNITS=IN DIMENSIONS=L DATA TIME INTERVAL=24 HOURS $ OUTPUT FORMAT=(3A4,2I2,I4,6F10.3)
Even More... • Spatial metadata (partial) example - top level: • Pajaro River Survey • Metadata: Identification_Information Data_Quality_Information Spatial_Data_Organization_Information Entity_and_Attribute_Information Distribution_Information Metadata_Reference_Information
Spatial Metadata continued... Identification_Information: Citation: Citation_Information: Originator: Ken Thompson Publication_Date: Unpublished material Publication_Time: Unknown Title: Pajaro River Survey Edition: 1st Geospatial_Data_Presentation_Form: map Series_Information: Series_Name: 1 Issue_Identification: 1 Publication_Information: Publication_Place: Not Published Publisher: None Larger_Work_Citation: Citation_Information: Series_Information: Publication_Information: Description: Abstract: Map of the lower Pajaro River Basin near Watsonville, CA. Purpose: Flood control improvement studies. Time_Period_of_Content: Time_Period_Information: Single_Date/Time: Range_of_Dates/Times: Multiple_Dates/Times: Calendar_Date: 19950328 Calendar_Date: 19950808 Currentness_Reference: Dates of photography Status: Progress: Complete Maintenance_and_Update_Frequency: Unknown Spatial_Domain: Bounding_Coordinates: West_Bounding_Coordinate: -121.8303 East_Bounding_Coordinate: -121.6687 North_Bounding_Coordinate: 36.9517 South_Bounding_Coordinate: 36.8488 Keywords:
Data Handling Summary • Information about the data (metadata) as important as the actual data • Data organization is critical • Expected use of the data will in part dictate how data are collected (e.g., measurement frequency) and handled (e.g., organization)


![[TC]²: Redefining Measurement Techniques](https://cdn4.slideserve.com/8405313/tc-redefining-measurement-techniques-dt.jpg)