Download
1 / 59
590 likes | 732 Views
South East Business Snapshot Survey Report Autumn 2010. November 2010. Contents. 1. Executive Summary 2. Background, Objectives & Methodology 3. Business Performance 4. Business Trends 5. Employment & Training 6. Business Investment 7. Costs & Finance 8. Business Profile.

E N D
South East Business Snapshot Survey ReportAutumn 2010 November 2010
Contents 1. Executive Summary2. Background, Objectives & Methodology3. Business Performance4. Business Trends5. Employment & Training 6. Business Investment 7. Costs & Finance8. Business Profile
Executive Summary (1) • The research results highlight the mixed fortunes of the area’s businesses. Overall business performance has remained largely unchanged over the last three months, but there are pockets of both growth and decline in most counties and sectors. • Whilst there are few consistent patterns emerging by sector or by county, the research does point to some significant findings: • Businesses in the Financial & Business services sector, the largest sector of the regions economy, have seen the most improvement. • Businesses in the Construction sector report tough trading conditions which look set to continue for the majority. • Larger companies appear to have been more successful in improving business performance during the last three months. • Businesses in Buckinghamshire are more likely to report worsening conditions; those in Oxfordshire and West Sussex were more likely to report improving conditions.
Executive Summary (2) • Generally businesses in the area are less optimistic about the business climate then they were at the beginning of this year. • A third (32%) expect the business climate to deteriorate in the next three months, however, the vast majority expect the climate to either remain stable (41%) or to improve (24%). • Staffing levels and investment in training have remained stable and are expected to be broadly unchanged in the coming 3 months. • Only one in ten businesses identified a skills gap (increasing to almost a third of businesses with 50+ employees), with over half of all skills gaps falling in the ‘administrative/ secretarial’ or ‘manager/ senior official’ occupational roles. • For most companies with skills gaps these have either decreased or remained unchanged since 2009.
Executive Summary (3) • Inflation (rising transport and raw materials/ bought-in services costs) is an issue affecting the majority of businesses. For now most have opted to absorb the cost increases rather than passing these on to the customer, but this is likely to have contributed to a rise in the number of businesses reporting falling profit margins, and could have also had a negative impact on cash flow levels. • Overall business investment has remained broadly stable in the last three months and it is likely that overall investments will remain unchanged in the next three months. • Most businesses claim not to need any additional finance; only one in ten have considered new forms of finance in the last 3 months. However for those who have considered it, the perception is that finance has become less available and more expensive during the last 3 months.
Research Background, Method & Objectives • This report presents the findings of the latest South East Business Snapshot Survey for Autumn 2010 conducted amongst businesses in the South East. • The research measures business performance on a range of key economic indicators, as well as business confidence (previous/next three months). • Critical Research Ltd undertook the survey on behalf of SEEDA, the Regional Development Agency for the South East. • The survey was conducted by telephone between 4th October and 25th October 2010. • In total 653 interviews were conducted. • All interviews were conducted with business respondents in a senior position. • In order to achieve a representative sample, quotas were set for county, industry sector and employee sizeband. • The results were then weighted to IDBR population counts for the South East by sector, county and employee sizeband. • Results are broadly comparable to the Autumn/ Winter 2010 Business Snapshot Survey. • Where ‘Net Balance’ scores are shown, these are calculated by taking the proportion of those who say ‘decreased’ away from the proportion who say ‘increased’.
Statistical Validity • When looking at comparisons by industry sector and county, we have focused on results that are statistically significant (indicated by blue boxes). • If a result is statistically significant, it means that the 19 times out of 20 the difference in the results would be ‘real’ and not due to chance or the research process. However if the base sizes of the results being compared are small, it increases the difference in the results required for them to be statistically significant. • For example, comparing two results where the base size is 80, the following approximate differences are required for the result to be significant: • A result of 50%, +/- 15% required to be significant • A result of 75%, +/- 12.5% required to be significant • A result of 90%, +/- 9% required to be significant • A minimum of 80 interviews was conducted in each county. It is worth noting that with these relatively small sample sizes, some differences between counties are likely to be due to differences in business profile by sector and size. • For this wave of the research, electricity, gas & water supply companies were included in the ‘Agriculture & Extraction’ sector instead of ‘Manufacturing’.
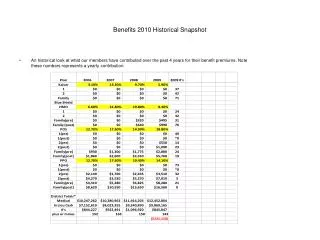
Sample Profile The table below shows the number of interviews achieved (unweighted).
Business Performance Last 3 months – Comparison with early 2010 Overall performance over the past 3 months has been mixed. Almost half (45%) of businesses reported that it has remained stable, however about one in four said it had either improved (27%) or got worse (28%). Compared to results in Winter/ Spring 2010, there has been a statistically significant increase (indicated by the blue box) in the proportion of businesses reporting that their performance has got worse (from 19% to 28%). Q1. Would you say that ,overall, your business/ organisation’s performance in the past 3 months has improved, remained stable or got worse? Base: All Respondents = 653
Business Performance Last 3 months – by Company Size Large businesses have performed better than smaller businesses in the last 3 months - they are significantly more likely to report an improvement in performance. Net Balance -1 -5 +18 +28 Q1. Would you say that ,overall, your business/ organisation’s performance in the past 3 months has improved, remained stable or got worse? Base: All Respondents = 653
Business Performance Last 3 months – by Age of Business More recently established businesses are more likely to report an improved business performance in the last 3 months – a trend continuing from Winter/ Spring 2010 - indicating that perhaps newer businesses are more adaptable. Net Balance -1 +10 +1 -4 Q1. Would you say that ,overall, your business/ organisation’s performance in the past 3 months has improved, remained stable or got worse? Base: All Respondents = 653
Business Performance Last 3 months – by County Performance across the area has been mixed. Businesses in Oxfordshire & West Sussex have enjoyed the strongest performance overall during the past 3 months, in contrast with those in Buckinghamshire. Net Balance -1 +27 +20 +7 +2 -4 -12 -14 -22 Q1. Would you say that ,overall, your business/ organisation’s performance in the past 3 months has improved, remained stable or got worse? Base: All Respondents = 653
Business Performance Last 3 months – by Sector Businesses in the largest sector, ‘Finance & Business Services’, have seen the most improvement. In contrast, the Construction sector has suffered the most during the past 3 months - two in five report that their business performance has got worse. Net Balance -1 +9 +7 +1 -2 -2 -5 -8 -20 Q1. Would you say that ,overall, your business/ organisation’s performance in the past 3 months has improved, remained stable or got worse? Base: All Respondents = 653
Business Performance Last 3 months – Reasons for Improvement More sales and an increase in orders and bookings are the most commonly cited aspects of performance that have improved over the last 3 months. Results are similar to those reported in Winter/ Spring 2010. Q2A. Which aspects of your business/ organisation’s performance have particularly improved? (Spontaneous) Base: All who believe that performance has improved = 196
Business Performance Last 3 months – Reasons for Improvement However some businesses in the South East have had to adapt in order to secure these improvements in performance. “…In this difficult market, our main task has been to keep winning work to keep everyone employed and we're succeeding in that. We've embarked recently on the environmental standard with BSI and that is beginning to improve our impact on the environment and also cost and waste awareness. We're just about to embark on a new IT system in the business which will take 6 months or so to integrate and we hope that will lead to improvements.” (Construction, 50+ employees) “Certainly, we're seeing sales volumes increase. General increase in manufacturing efficiency. We're reducing waste. We're doing it quicker and being more efficient.” (Manufacturing, 50+ employees) “Sales have improved. Because we're such a niche market, the market is changing ….looking for more of a bespoke service. Phone calls from customers are answered quickly and calls returned promptly. We respond to enquiries within 24 hours. Facebook, Twitter and blogs and interactive websites help - with social media its easier to get our offers out there and people get to know us better…” (Transport & Communications, 1 employee) “….The recession has made us think about everything we do and has made us become a much more leaner and meaner organisation. I think that just about sums it up. Customer interest in what we do has improved because most of our customers didn't know all the services we do under one roof. Much of our sales pitch is getting customers into the factory. As a result of us being leaner and meaner, we have drastically improved deliveries so a lot of customers now come to us because of deliveries rather than cost.” (Construction, 10-49 employees) Q2A. Which aspects of your business/ organisation’s performance have particularly improved? (Spontaneous) Base: All who believe that performance has improved = 196
Business Performance Last 3 months – Reasons for Decline Businesses with declining performance report that sales are down and that the market is generally less buoyant with fewer customers and less work available. Results are similar to those reported in Winter/ Spring 2010. Q2B. Which aspects of your business/ organisation’s performance have got worse? (Spontaneous) Base: All who believe that performance has got worse = 148
Business Performance Last 3 months – Reasons for Decline Businesses with declining performance face a range of issues. “Contract work with the local government has gone down by about 60%. We used to do a lot of work for them and now they have sourced it elsewhere. We are also receiving less airport and local work. The business is downsizing.” (Transport & Communications, 1 employee) “There are no customers coming into the shop, there are no enquiries, there are no phone calls. The business is down in a way I have never experienced. Many different aspects. It's a small business and I was working more on a community basis around here and I'd provide any kind of small service that they needed. But there isn't any work coming in.” (Manufacturing, 2 employees) “Costs to the business are increasing, particularly transport costs. Cattle prices have gone down.” (Agriculture, 3 employees) “We manufacture to order across a wide range of sectors, it's all quiet. Normally we have repeat business on orders but there have been no repeat orders and very few new enquiries for design of product. Generally with enquiries, we would get 10-15 design enquiries a day but now we are getting about 3.” (Manufacturing, 10-49 employees) “All of it. The town centre in which we are based has died so there is no work coming in because no one comes to the town centre anymore. Most of our business is reliant on that as it is a local taxi firm so we rely on local people using our services.” (Transport & Communications, 2 employees) Q2B. Which aspects of your business/ organisation’s performance have got worse? (Spontaneous) Base: All who believe that performance has got worse = 148
Business Climate Expectations Next 3 months – Comparison with Winter/ Spring 2010 Expectations of the business climate in the next 3 months are mixed – 41% expect the business climate to remain stable, however 32% expect it to worsen. A quarter (24%) expect the business climate to improve. Compared to results in Winter/ Spring 2010, there has been a significant increase in the proportion of businesses expecting the business climate they operate in to get worse (from 10% to 32%). Q3. Over the next 3 months, do you expect the business climate in which your business/ organisation operates to improve, remain stable or generally get worse? Base: All Respondents = 653
Business Climate Expectations Next 3 Months – by Company Size On balance, smaller businesses are slightly less optimistic about the next 3 months, however the difference when compared with larger companies is not statistically significant. Net Balance -8 -10 0 -1 Q3. Over the next 3 months, do you expect the business climate in which your business/ organisation operates to improve, remain stable or generally get worse? Base: All Respondents = 653
Business Climate Expectations Next 3 Months – by County There is no clear pattern by county. Businesses in Surrey are more uncertain than most – just 29% expect the business climate to remain stable, significantly lower than the areas average of 41%. Net Balance -8 -11 -8 -22 -7 -16 +9 +1 -2 Q3. Over the next 3 months, do you expect the business climate in which your business/ organisation operates to improve, remain stable or generally get worse? Base: All Respondents = 653
Business Climate Expectations Next 3 Months – by Sector Mixed opinions between and even within each sector. Almost half (47%) of businesses in the Construction sector expect the business climate to get worse in the next 3 months. Net Balance -8 -18 -10 +2 +18 -9 +2 -17 -32 Q3. Over the next 3 months, do you expect the business climate in which your business/ organisation operates to improve, remain stable or generally get worse? Base: All Respondents = 653
Business Performance/ Expectations Combined The majority of businesses (57%) are experiencing uncertain business performance levels. 8% are experiencing continued growth, however 14% are in decline. There is stability for about one in five (22%). Segments defined according to responses to overall performance in the last 3 months and expected business climate in the next 3 months. ‘Growth’ businesses are defined those reporting that their business performance has improved in last 3 months, and they expect the business climate to improve in the next 3 months. ‘Stable’ businesses are defined as those reporting that their business performance has remained stable in the last 3 months and expect it to remain stable in the next 3 months. ‘Declining’ businesses are defined as those reporting that their business performance has declined in the last 3 months and expect a further decline in the next 3 months. For the remaining businesses there is no clear trend. Q1. Would you say that ,overall, your business/ organisation’s performance in the past 3 months has improved, remained stable or got worse?/ Q3. Do you expect the business climate in which your business/ organisation operates to improve, remain stable or generally get worse? (Base: All Respondents = 653)
Profile of ‘Growth’ & ‘Declining’ Businesses • ‘GROWTH’ BUSINESSES • Account for 8% of businesses in the South East. • Growth businesses are more likely to have 10+ employees (29% v 16% average). • They also tend to be younger businesses (51% trading for less than 10 years compared to average of 29%). • ‘Growth’ businesses are more likely to be in the ‘Finance & Business Services’ (30%) or ‘Public Sector/ Other Services’ sectors (19%). • Less likely to have experienced rising costs (32% say costs have not increased versus 19% overall). • ‘DECLINING’ BUSINESSES • Account for 14% of businesses in the South East. • Almost half have 2-4 employees (47% compared to 33% average). • Majority (70%) have been trading for 10 years or more. • 29% of ‘Declining’ businesses are in the ‘Finance & Business Services ‘sector; 22% are in the Construction sector. • Three quarters (73%) of ‘Declining’ businesses have experienced an increase in transport costs (55% average). Over half (57%) have also experienced an increase in the cost of raw materials (46% average). Q1/ Q3. Combined. Growth Businesses defined as those who said that performance in the past 3 months has improved, and expect the business climate in the next 3 months to improve (Base: 70). Declining Businesses defined as those who said that performance in the past 3 months had got worse, and expect the business climate in the next 3 months to get worse (Base: 71)
Business Trends Last 3 Months - Region Whilst overall there is relative stability in terms of the numbers employed, staff costs and prices charged to customers, the trend towards falling profit margins and cash flow continues. Experience of the domestic market and the volume of output is mixed. Net Balance -8 -1 -2 -2 -11 +2 -25 -17 Q4A. Excluding seasonal variations, what has been the trend during the past 3 months for each of the following...? I'm going to read out a list, for each one please tell me whether the trend has been higher, the same, or lower. Base: All Respondents = 653
Business Trends Next 3 Months - Region Business expectations regarding domestic orders and the volume of output are also mixed. Approaching a third of businesses (30%) expect profit margins and cash flow to fall over the next 3 months. However the number of staff employed and staff costs are expected to remain stable. Net Balance -2 +1 0 +2 +5 +7 -11 -11 Q5A - H. Now thinking about the next 3 months, what are the expected trends for each of the following? I'm going to read out a list, for each one please tell me whether the trend has been higher, the same, or lower. Base: All Respondents = 653
Business Trends Last 3 Months – Domestic Orders by Sector Businesses in the ‘Finance & Business Services’ sector are significantly more likely than the average to report higher sales (27% compared to 20% on average) – however a quarter also report falling sales (25%). Domestic orders have fallen more sharply in the Construction sector - here 42% of businesses report falling sales. Q4A. Domestic Orders. What has been the trend during the past 3 months? Base: All Respondents = 653
Business Trends Next 3 Months – Domestic Orders by Sector Seasonal trends are apparent. Businesses in the ‘Hotels & Restaurants’ sector are more optimistic than in other sectors – over a third expect domestic orders to be higher in the next 3 months. In contrast there appears to be little expectation of an upturn in the Construction sector. Q5A. Domestic Orders. What is the expected trend during the next 3 months? Base: All Respondents = 653
Current Business Capacity – Comparison with Winter/ Spring 2010 Almost two thirds of businesses are operating below capacity. This has not changed when compared with Winter/ Spring 2010 results. Businesses in the Manufacturing and Construction sectors are significantly more likely to be operating below capacity (both 74%). Those in the ‘Agricultural & Extraction’ sector are significantly less likely to be operating below capacity (46%). Q6. Is your present level of output below capacity, that’s to say are you working below a full rate of operation? Base: All Respondents = 653
Employment Trends –Last 3 Months/ Next 3 Months - Region Employment levels are fairly static across the area – the majority (79%) of businesses report that the number of staff employed has remained the same over the last 3 months, and a similar proportion (77%) expect to remain the same over the next 3 months. There is little change compared to results in Winter/ Spring 2010. Businesses in the ‘Hotels & Restaurants’ and Construction sectors were significantly more likely than the average to report a decrease in the number of staff employed in the last 3 months (27% and 18% respectively). Businesses in Oxfordshire were twice as likely to report that staff levels had increased in the last 3 months (16% compared to average of 7%). Q4C. Numbers employed. What has been the trend during the past 3 months? Q5C. Numbers employed. What is the expected trend during the next 3 months? Base: All Respondents = 653
Skills Gaps – by Company Size Only one in ten businesses currently have a skills gap their existing workforce – i.e. where the workforce is not proficient in the role they currently undertake. Skills gaps are more prevalent in larger organisations – almost a third (31%) of those with 50+ employees identified a skills gap. Q21. Do you currently have skill gaps in your existing workforce, i.e. where the workforce is not proficient in the role they currently undertake?(Base: All Respondents = 653)
Skills Gaps – by Sector Businesses in the Manufacturing and the Retail, Motor & Wholesale sectors are most likely to have skills gaps – about one in five currently do. In contrast there are few skills gaps in the Finance & Business Services sector (3%). There is no significant difference in the extent of skills gaps reported by county. Q21. Do you currently have skill gaps in your existing workforce, i.e. where the workforce is not proficient in the role they currently undertake?(Base: All Respondents = 653)
Skills Gaps –by Occupational Role Amongst businesses with skills gaps (i.e.10% of all businesses), most gaps were in the administrative and secretarial occupational roles, followed by managers and senior official roles (NB. Small sample size of 104). Majority (63%) say this skills gap has stayed the same compared to 2009, and a similar proportion (60%) are confident they will be able to find the training required locally. (Base: All with skills gap in this role = 31) Over half (57%) of businesses with skills gaps are confident they can find the training they need locally; 19% are not confident. Q22. Do you currently have any skill gaps in your existing workforce in these type of roles? (Base: All Respondents with skills gaps = 104)
Investment in Training –Last 3 Months/ Next 3 Months - Region The trend for investment in training or re-training has been fairly static during the last 3 months and is not expected to change in the next 3 months. The proportion of businesses who have or expect to invest less on training or re-training has increased compared to Winter/ Spring 2010 results. Larger companies were more likely to have increased their investment in training in the past 3 months (31% of those with 50+ employees), and this trend is expected to continue. Businesses with a skills gap were more likely to expect the amount they spend on training to increase in the next 3 months (27% compared to 10% for those without skills gaps). Q7E. Training and re-training. What has been the trend for investment in this during the past 3 months? Q8E. Training and re-training. What is the expected trend for investment in this during the next 3 months? Base: All Respondents = 653
Business Investment Trends –Last 3 months – Comparison with Winter/ Spring 2010 Overall investment has remained stable, with two thirds of businesses reporting that it has not changed during the last 3 months. Compared to results in Winter/ Spring 2010, the proportion of businesses reporting an increase in investment levels has almost halved (from 29% to 15%). Q7F. On balance, what has been the trend for overall investment in the business during the past 3 months? (Prompted) Base: All Respondents = 653
Business Investment Trends –Next 3 Months – Comparison with Winter/ Spring 2010 Expected business investment levels in the next 3 months are unlikely to change, however they are slightly less uncertain than in the previous survey (60% say level will remain the same for the next three months, compared to 50% in the Winter/Spring survey). Expected investment levels still represent a fall from expected levels reported in the Winter/ Spring 2010 survey. Q8F. On balance, what is the expected trend for overall investment in the business in the next 3 months? (Prompted) Base: All Respondents = 653
Business Investment Trends –Last 3 Months by Region For the majority of businesses investment levels for each category have remained broadly stable. Q7A - E. What has been the trend during the past 3 months in relation to your investment in each of the following ...? Please tell me whether the trend has been higher, the same, or lower. Base: All Respondents = 653
Business Investment Trends –Next 3 Months by Region Levels of investment are generally not expected to change significantly over the next 3 months, however one in four businesses expect an increase in investment in marketing and sales. Q8A - E. What is the expected trend in the next 3 months in relation to your investment in each of the following ...? Please tell me whether the trend is likely to be higher, the same, or lower. Base: All Respondents = 653
Business Costs – Increased in Last 3 Months Costs continue to rise; 8 out of 10 businesses (80%) have experienced an increase in costs over the past three months. About half of all businesses reported an increase in transport costs and the cost of raw materials/ bought-in services over the last three months. Results are similar to those reported in Winter/ Spring 2010, although there has been a fall in the proportion expecting an increase in energy costs. 50% say this increase is due to taking on more staff; 43% due to staff pay rises. Q9. I’d now like to ask you about costs to your business/ organisation. Which , if any, of the following costs have increased over the past 3 months? (Prompted) Base: All Respondents = 653
Business Costs – Most Significant Cost Increase in Last 3 Months Transport costs, and the cost of raw materials/ bought-in services, have both overtaken energy costs to become the most significant costs for businesses. Q10. And which one of these costs, if any, have placed most upward pressure on your overall cost base? (Prompted) Base: All Respondents = 653
Business Costs – Passed on to Customers in Last 3 Months – Comparison with Winter/ Spring 2010 Approaching two thirds of businesses are absorbing the increase in costs rather than passing them on to their customers. The proportion of businesses choosing to absorb the increase in costs has increased when compared to results in Winter/ Spring 2010. Q12. Have you passed on any increases in costs to your customers over the past 3 months? (Prompted) Base: All Respondents who have experienced an increase in costs = 529
Profit Margins – Last 3 Months/ Next 3 Months by Region Over the last 3 months 42% of businesses reported stable profit margins, but a similar proportion (39%) reported falling profit margins. However there is a slight upturn in expected profit margins for the next 3 months. Over half of businesses in the Construction sector (56%) reported falling profit margins during the last 3 months – significantly higher than average. About half (48%) expected profit margins to remain the same in the next 3 months. Compared to Autumn/ Winter 2010 results, businesses are less optimistic about their likely profit margins in the next 3 months (previously 32% had expected an increase). Q4G. Profit margins. What has been the trend during the past 3 months? Q5G. Profit margins. What is the expected trend during the next 3 months? Base: All Respondents = 653
Cash Flow –Last 3 Months/ Next 3 Months - Region Whilst almost half of businesses have experienced and expect stable cash flow, about one in three have experienced or anticipate reduced levels of cash in the business. About one in five expect to see an improvement in the next 3 months. Winter/ Spring 2010 results are similar, although businesses were more optimistic back then – 31% had expected an increase in cash flow over the following 3 months. Over half of businesses in the Construction sector (55%) reported lower cash flow in the last 3 months – significantly higher than average. Q4H. Cash in the business – cash flow. What has been the trend during the past 3 months? Q5H. Cash in the business – cash flow. What is the expected trend during the next 3 months? Base: All Respondents = 653
Business Finance – Considered/ Sought in Last 3 Months Only one in ten businesses (11%) have considered new finance or new lines of credit, but only half of these (6%) actually sought finance – a fall from 9% in the Winter/ Spring 2010 survey. 39% of those seeking finance obtained it (a fall from 62% in Winter/ Spring). Businesses in the ‘Agriculture & Extraction’ sector were significantly more likely to have considered finance (22%). Businesses with 10-49 employees were significantly more likely to have considered finance (21%). Business with 50+ employees were significantly more likely to have obtained finance (10%). Q13. Have you considered any new finance or new lines of credit for your business in the past 3 months? (Base: All Respondents = 653). Q14. Have you actually sought new finance? (Base: All Considered = 106). Q16. Did you successfully obtain the finance? (Base: All Sought = 60).