Download
1 / 33
330 likes | 457 Views
Topics in Clinical Trials (3 ) - 2012. J. Jack Lee, Ph.D. Department of Biostatistics University of Texas M. D. Anderson Cancer Center. Adaptive Randomization. The allocation probability is not fixed and continue to change as the study progresses. Allocation probability depending on

E N D
Topics in Clinical Trials (3) - 2012 J. Jack Lee, Ph.D. Department of Biostatistics University of Texas M. D. Anderson Cancer Center
Adaptive Randomization • The allocation probability is not fixed and continue to change as the study progresses. • Allocation probability depending on • previous allocation • baseline covariates • outcome • Goals: • More balanced treatment allocation • Balanced treatment assignment wrt covariates • More ethical
Baseline Adaptive Randomization • Biased coin design • Equal allocation unless the imbalance exceeds D, then, use allocation ratio of 2:1 in favor of the ‘deficient randomization’ group. • Urn design • With m red balls and m black balls • If a red ball is drawn, assign pt to tx A • Return the red ball but add a black ball to the urn. • Repeat the process … • Both are somewhat complicated to implement • Variance of the test statistics will be larger if don’t considered the randomization scheme more conservative test
Baseline Adaptive Randomization (Cont.) • Minimization procedure • Assign pt to the treatment which can ‘minimize’ imbalance. • Not a random process • Pocock and Simon dynamic allocation • Achieve marginal balance with a large number of prognostic factors • A web-based program for conducting the trial has been developed at M.D. Anderson • A stand alone program is available Pocock and Simon, Biometrics, 1975
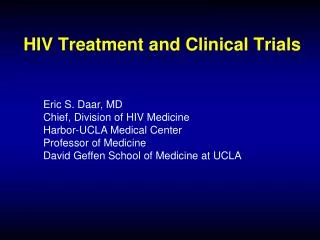
Pocock-Simon Dynamic Allocation • At any given time of the trial • Xik= # assigned in txk with factor i • If next pt assigned to tx t • Xtik = Xikif t k = Xik + 1 if t= k, for tx t • Let B(t) = imbalance function over all factors if the next pt is assigned to t • For example: B(t) = wi Range(Xti1, Xti2) • wiis a prespecified weight (of importance) for factor i • Small B(t) is preferred. Therefore, assign pt to t with a probability of p (p > ½) if B(t) is small.
B (1) = 3 x 3 + 2 x 1 = 11 B (2) = 3 x 1 + 2 x 3 = 9
Response Adaptive Randomization • Deterministic • Play-the-winner • Probabilistic • Urn model (add one ball with same/diff. Tx if S/F ) • Two-arm bandit problem • Goal: max. # of pts assigned to the superior arm • Advantage: • Treat more pts in the better result groups • Disadvantage/Limitation • Imbalance results in loss of efficiency • Require response to be measured quickly
Example 1: ECMO Trial (Randomized Play the winner) • Extracorporeal membrane oxygenator in persistent pulmonary hypertension of the new newborn • The trial was stopped and declared ECMO effective. • Was the result convincing? • Pros and Cons? • 2nd pt was much sicker that all other pts? • What’s next?
Follow-up Trial • Phase 1, patients are equally randomized into ECMO or CMT until total of 4 deaths are observed in one of the arm. • Switch to Phase 2. All patients are assigned to the other arm until 4 deaths are observed or at least 28 patients are treated. • The trial has a 5%, 1-sided type I error and 77% power under Ho: P1 = P2 = 0.2 vs. H1: P1= 0.2, P2 = 0.8 • Data showed that the lower end of the 95% CI for P2– P1= 0.131 Ware, Statistical Science, 1989
Simple Adaptive Randomization (AR) Consider two treatments, binary outcome First n pts equally randomized (ER) into TX1 and TX2 After ER phase, the next patient will be assigned to TX1 with probability , where • Note that the tuning parameter • = 0, ER • = 0.5 or 1 or n/(2N) • = , “play the winner” • Continue the study until reaching early stopping criteria or maximum N
Example 2: Randomized Two-Arm Trial Frequentist’s approach Ho: P1 = P2 vs. H1: P1 < P2 P1 = 0.3, P2 = 0.5, =.025 (one-sided), 1 = .8 N1 = N2 = 103, N = 206 Bayesian approach with adaptive randomization Consider P1 and P2 are random; Give a prior distribution; Compute the posterior distribution after observing outcomes Randomize more patients proportionally into the arm with higher response rate At the end of trial, Prob(P1 > P2) > 0.975, conclude Tx 1 is better Prob(P2 > P1) > 0.975, conclude Tx 2 is better At interim, Prob(P1 > P2) > 0.999, Stop the trial early, conclude Tx 1 is better Prob(P2 > P1) > 0.999, Stop the trial early, conclude Tx 2 is better
AR Comparisons Use the AR program from http://biostatistics.mdanderson.org/SoftwareDownload/
ER versus AR • ER is consistent with the equipoise principle which justifies randomization in clinical trials. • In the case of H0: p1 = p2 vs. H1: p1 < p2 • Suppose the true p1=0.2, p2=0.4 • We need N=134 to achieve =0.1, 1- = 0.9 • If you were patient number 130 in the trial, do you want to be equally randomized? • AR tilts the randomization ratio with the goal of treating patients better during the trial but still controls type I and type II errors. • Pay a price: N increase to achieve the same power • How to choose the allocation ratio for AR? • True p1 and p2 are unknown, let the data guide us. • What criteria to use to compare the methods?
Optimal Allocation Ratio for AR into Arm 2 • Frequentist designs • Neyman allocation: maximize power • RSIHR allocation: minimize expected treatment failure for a fixed asymptotic variance Rosenberger et al. (Biometrics, 2001), Hu and Rosenberger (JASA 2003) • Bayesian designs • Robust Bayes approach via backward induction maximize total number of successes in patient horizon Berry and Eick (SIM 1995) • r-design Cheng and Berry (Biometrika 2007)
Mechanism of Randomization • Worst: Investigator performs randomization • Toss a coin • Best: A central, independent, randomization center • Baseline imbalance • 14% in 57 studies randomization unknown to PI • 26.7% in 55 studies randomization was known to PI • 58% in 43 non-randomized studies • Sequenced and sealed envelopes on site • Telephone randomization • Random assignment list kept in pharmacy • Web-based computer randomization
Study Blindness • Bias can invalidate the study findings. • Bias can be caused by conscious or subconscious factors. • The general solution is to keep the participants and investigators blinded or masked to the assigned intervention. • Blindness helps the uniformity in trial conduct, e.g.: in giving concomitant and compensatory treatment. • It will also help in the objective assessment of response variables.
Fundamental Point • A clinical trial should, ideally, have a double-blind design to avoid potential problems in bias during data collection and assessment. • In studies where such a design is impossible, a single-blind approach and other measures to reduce potential bias are favored.
Type of Trials • Unblinded trials • E.g.: surgical trials, lifestyle change • Advantage: easier to design and conduct, less expensive • Disadvantage: subject to a host of bias, which can be difficult to measure or correct • Vitamin C trial: Unequal drop-out; drop-in; Influence the treatment course and outcome assessment • By-pass surgery vs. medication: equal baseline smoking status, more quitter in surgery arm in the trial confounding • Single-blinded trials • Only the investigators are aware of the tx assignment. • Same problems as unblinded trials but maybe to a lesser extent.
Double-blinded trials • Reduce the risk of bias • Placebo effect • In assessing toxicity (e.g.: run-in) and efficacy • Great efforts needed to manufacture placebo with matched size, shape, color, sheen, odor, taste, etc. Can be expensive to make. • Special considerations are needed for drug labeling and distribution. • Periodically checking or sampling the drug content may be necessary. • Lab test such as checking the serum level may be helpful in monitoring the trial conduct. The results have to be kept confidential though.
The Use of Placebo • Reduce the placebo effect. • Matching placebo is required for each active agent. For example, in a 2x2 factorial design, every participant takes 2 kinds of pills. • Can be cumbersome with large number of active drugs. • With active drugs A, B, C and placebo D, can make D in three kinds. Each one matched with one active drugs. • May not be possible of the route (p.o./IV) or the pattern of administration (q.d., b.i.d., t.i.d., q.i.d.) is different.
UnblindingOccurred in Trials • Characteristic side effects • e.g.: beta-carotene (yellowing skin) • 9cRA (headache) • Participants comparing drugs in the waiting room • Participants try to find out • Oversight in labeling, lab testing • Adverse drug reaction (ADR) • Patient’s safety
Triple-blinded trials • Pts, investigators, and DMC are all blinded. • DMC’s ability of monitoring safety and efficacy can be hampered by being blinded to the tx assignment. The design can be counterproductive. • Improvement: DMC is blinded first but code can be broken per request.
Homework #3 (due Feb 2) (10 points, 2 point/question) Assume T1 and T2 are the test statistics for Test 1 and Test 2. The relative efficiency of Test 2 vs. Test 1 is defined as RE = Var(T1)/Var(T2) Suppose two-sample z-test (known variance) is used to compare the outcome of two treatment groups with a total sample size of 100. Let p1 be the proportion of patients allocated to Arm 1. • Under the assumption of equal variance of 1, plot Var(T| p1) vs. p1 for p1 = 0.1 to 0.9. • Let p1* be the optimal allocation for assigning patients to Arm 1 which yields the smallest variance for the test statistics. Find p1*. • Plot RE of p1vs. p1* (on the y-axis) against p1 (on the x-axis) for p1 = 0.1 to 0.9. • What is the loss of efficiency for 1:2, 1:3, and 1:4 randomization. • Find out the optimal allocation rule p1* in the case of unequal variance. Assume the variance of treatments 1 and 2 are s12 and s22, respectively.
Homework #4 (due Feb 2) (10 points, Please attach the computer code.) For testing equal proportion in the two-sample case, using the normal distribution to approximate the binomial distribution. • Please write down the model, the null and alternative hypotheses, the test statistics, and the asymptotic distribution of the test statistics. • Let p1 be the proportion of patients allocated to Arm 1. Please find p1* which is the optimal allocation to yield the highest power (or the smallest variance for the test statistics), i.e., the Neyman allocation. • Please derive the RSIHR allocation. • Draw the Neyman allocation and RSIHR allocation versus the probability of success in Arm 1 (p1) for p1 between 0 to 1. • Please comment on the above plot regarding the relative merit of the two allocation methods.