Download
1 / 59
590 likes | 597 Views
Ag Outlook. GNB Bank Meeting Iowa Falls, IA Dec. 6, 2016 Chad Hart Associate Professor/Crop Markets Specialist chart@iastate.edu 515-294-9911. U.S. Corn Supply and Use. Source: USDA-WAOB. U.S. Soybean Supply and Use. Source: USDA-WAOB. Corn Yield Estimates. Top: 2016 Yield

E N D
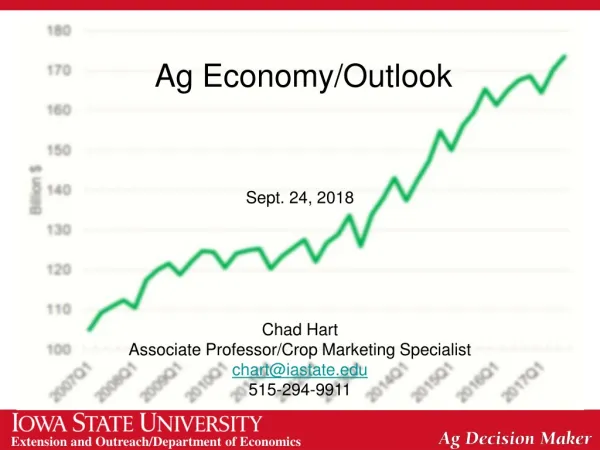
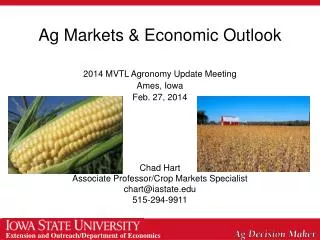
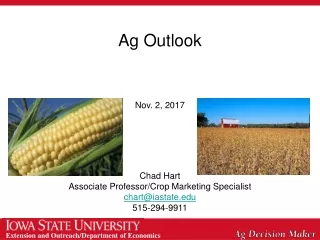
Ag Outlook GNB Bank Meeting Iowa Falls, IA Dec. 6, 2016 Chad Hart Associate Professor/Crop Markets Specialist chart@iastate.edu 515-294-9911
U.S. Corn Supply and Use Source: USDA-WAOB
U.S. Soybean Supply and Use Source: USDA-WAOB
Corn Yield Estimates Top: 2016 Yield Bottom: Change from last month Units: Bushels/acre Source: USDA-NASS
Soy Yield Estimates Top: 2016 Yield Bottom: Change from last month Units: Bushels/acre Source: USDA-NASS
World Corn Production Source: USDA-WAOB
World Soybean Production Source: USDA-WAOB
Drought Monitor Source: National Drought Mitigation Center
Hog Crush Margin The Crush Margin is the return after the pig, corn and soybean meal costs. Carcass weight: 200 pounds Pig price: 50% of 5 mth out lean hog futures Corn: 10 bushels per pig Soybean meal: 150 pounds per pig Source: ISU Extension
Cattle Crush Margin The Crush Margin is the return after the feeder steer and corn costs. Live weight: 1250 pounds Feeder weight: 750 pounds Corn: 50 bushels per head Source: ISU Extension
U.S. Meat Production & Prices Source: USDA-WAOB
Corn Export Sales Source: USDA-FAS
Change in Corn Export Sales Source: USDA-FAS
Soybean Export Sales Source: USDA-FAS
Change in Soybean Export Sales Source: USDA-FAS
Strength of the U.S. Dollar Source: Federal Reserve
Crude Oil Prices Sources: EIA and CME
Current Corn Futures 3.67 3.35 Source: CME Group, 12/5/2016
Current Soybean Futures 9.84 9.73 Source: CME Group, 12/5/2016
Beef: + 2015.Q4 Pork: + 2015.Q1 Total Poultry: +2012.Q4 Data Source: USDA-NASS, Compiled & Analysis by LMIC Livestock Marketing Information Center
2017 2016 2015 Data Source: USDA/ERS
2016 Beef Cattle Situation • Transition to larger beef supplies in 2016 has been challenging • Cow-calf: Converging toward long-term levels • Herd expansion slowed, stalled, or stopped? • Stocker: Varies widely across situations • Opportunities vs. risk of owning cattle and managing risk • Feedlot: Worst behind us (I think), still red ink • Structural concerns—excess capacity, price discovery, etc.
Data Source: USDA & LMIC, Compiled by LMIC Livestock Marketing Information Center
Beef Cow Culling Rates 2005 = 7.7% (6.6%) 2006 - 2007 = 9.4% (8.0%) 2008 - 2012 = 11.2% (9.6%) 2013 = 10.5% (9.1%) 2014 = 8.8% (7.7%) 2015 = 7.6% (6.5%) 2016 = 7.1% (7.1%) 2016 Slaughter +13.0% (vs. 2015) -23.2% (vs. 2010-14) Data Source: USDA-AMS & USDA-NASS Livestock Marketing Information Center
36.8% is average between 1996‐2016 HEIFER REPLACEMENTS 2016: +3.5% 2015: +9.6% 1993: +8.0% 1982: +7.7% Data Source: USDA/NASS
Cattle on Feed―11/18 report • (1,000+ head capacity feedlots; & < 1,000 in Iowa) • Oct 1 On Feed: -1.3% yr/yr • Vs. -1.1% pre-report est. -2.3%, -0.5%) • IA: -6.3% vs last year [1,000+ Head] • IA: 0.0% vs last year [<1,000 Head] • Sep Placements: -5.0% • Vs. -4.9% pre-report est. (-10.1%, -3.4%) • IA: -17.3% vs last year [1,000+ Head] • IA: +11.0% vs last year [<1,000 Head] • Sep Marketings: +4.6% • Vs. +4.4% pre-report est. (+3.1%, +6.5%) • IA: -15.0% vs last year [1,000+ Head] • IA: -36.5% vs last year [<1,000 Head] -3.5% -7.6% -24.2% Data Source: USDA/NASS
Steer Live Weights This week: 1,447 Last week: 1,464 Last year: 1,453 Heifer Live Weights This week: 1,322 Last week: 1,320 Last year: 1,294 Data Source: USDA-NASS, Compiled & Analysis by LMIC Livestock Marketing Information Center
Data Source: USDA-AMS Livestock Marketing Information Center
2013 = -$59.43 [-$155 to +$77] 2014 = +$197.24 [+$41 to +$ 269] 2015 = -$225.12 [-$530 to +$43] 2016f = -$113.29 [-$359 to +$113] 2017f = -$26.44 [-$108 to +$114]
U.S. Beef Exports, Jan-Sep 2016 (Volume excluding by-products & variety meats) WASDE U.S.: 2015: 2,265 mil lbs 2016: 2,459 (+9%) 2017: 2,630 (+7%) Source: USDA/ERS
U.S. Beef Imports, Jan-Sep 2016 (Volume excluding by-products & variety meats) WASDE U.S.: 2015: 3,371 mil lbs 2016: 3,011 (-11%) 2017: 2,680 (-11%) Source: USDA/ERS
Relative Changes in Beef & Cattle Prices Source: USDA/ERS, USDA/AMS
2016 Pork Situation • Processing capacity squeeze. 1998 Déjà vu??? • Demand is always an important driver. But we first need to understand supply dynamics. • Lower hog and pig prices have likely raised the red flag on further expansion, at least for now. • Longer-term additional expansion is quite possible • Low feed grain prices, packer competition • Revisions to H&P report complicate analysis
Data Source: USDA-ERS & USDA-FAS Livestock Marketing Information Center
2013 = +$6.21 [-$25.60 to +$24.57] 2014 = +$61.85 [+$13.15 to +$107.25] 2015 = +$7.93 [-$18.40 to +$26.25] 2016f = -$1.46 [-$30.11 to +$32.92] 2017f = -$4.40 [-$23.31 to +$17.97]