Download
1 / 41
410 likes | 537 Views
Fertilizer Outlook, Precision Ag, Water Quality, Increased Efficiency. Fertilizer Outlook A Global Market. Real GDP Growth and Trend (% Change). Emerging economies continue more rapid growth rates. Numbers of Under-nourished People in the World*.

E N D
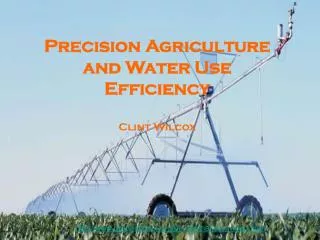
Fertilizer Outlook, Precision Ag, Water Quality, Increased Efficiency
Fertilizer Outlook A Global Market
Real GDP Growth and Trend (% Change) • Emerging economies continue more rapid growth rates
Numbers of Under-nourished People in the World* *Source: Food and Agricultural Organization of the United Nations (FAO)
World Cereal Production and Utilization (million tons)* *Source: FAO
Global Cereal Stocks to Use Ratio from 1995-96 to 2009-2010* *Source: FAO
Anticipated Annual Variations inAggregate Regional Fertilizer Demandbetween 2007/08 and 2010/11 (Mt nutrients)* *Source: International Fertilizer Industry Association (IFA)
China Buys Potash(Green Markets, Jan. 4, Vol. 34, pg. 1) • Belarusian Potash Co. (BPC) concluded a deal to sell potash to China for January-Dec. 2010 • Deal is for 1.2 million metric tons with an option for 200,000 additional tons • Price is $350/metric ton (~$318/short ton) CFR • Is this the new floor price for potash?
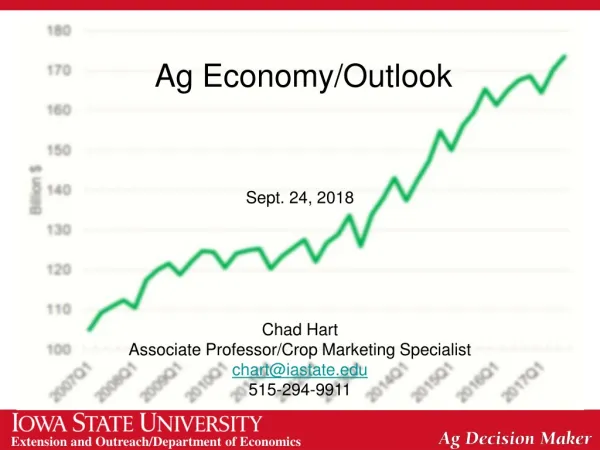
Current Commodity Situation *Corn, Soybeans, and Soy Meal – Chicago Board of Trade Futures, 5 January 2010. **Feeder Cattle – CME Futures, 5 January 2010 http://www.cmegroup.com/trading/commodities/
Efficiency • Yield levels that cover • fixed costs and provide • for profits • Land cost • Input cost • Technology that maximizes the • use of all inputs
N (lbs/acre) Yield (lbs/acre) 50 ~4800 100 ~6200
Fertilizer Management Winter-Spring 2010 • Crop Response to fertilizer applications • Initial applications of N, P, and K give greatest responses IF SITE IS RESPONSIVE • Review soil test levels from last year • Fields that were medium to low and did not receive P and K would be expected to be the most responsive to P and K fertilizer applications this year • If P soil test levels were high to very high, decline in soil test level will not be expected to be great for silt loam and clay loam soils. • Soil test K levels will decline more rapidly due to higher rates of removal with silage, hay, and straw removal.
Fertilizer Management Winter-Spring 2010 • Review blends • N-K blends without P may be more productive than the typical N-P-K blends that have been used in previous years. • Consider more split applications for N and K during the year to reduce risk. Apply second applications only if soil moisture is available and forage is needed. • Tissue test forages to verify adequate nutrition or determine what nutrients may be low. • Get soil tests early to be able to plan as much as possible.
Increased Efficiency and Precision AgConvergence of Technologies • Precision Ag • Computer programs • Lower cost • More user friendly • Web-based • Stand alone • GPS units • Lower cost • Enable “Smart sampling” • Application Equipment • Controllers – reduced cost • Applicators – Flexible
Fertilizer Management Winter-Spring 2010 • Uniformity of application is critical. • Doubling the rate of application does not double yield! • First 100 lbs = 3700 lbs DM • Second 100 lbs = 2200 lbs DM
Water Quality Regional, State and Local Issue Total Maximum Daily Load (TMDL) Development for the Chesapeake Bay Ref. Federal Register 74, No.179, Sept. 17, 2009 Ref. The Next Generation of Tools and Actions to Restore Water Quality in the Chesapeake Bay. Sept. 9, 2009. www.executiveorderchesapeakebay.net
Compliance and Enforcement RoleEnforcement Tools Currently Available • Designate AFOs as CAFOs making them subject to permitting requirements • Audit, inspect, and provide compliance assistance to improve best management practices and stormwater management plans • Enforce stormwater requirements at large construction sites to reduce sediment loss • Enforce new source review, and permit requirements at stationary sources and mobile source regulations at port facilities, warehouses, and construction sites to reduce Nox emissions Reference: The Next Generation of Tools and Actions to Restore Water Quality in the Chesapeake Bay. www.executiveorderchesapeakebay.net page A-3 and A-4
Compliance and Enforcement RoleEnforcement Tools Currently Available • Monitor compliance with major milestones for installing controls at wastewater treatment plants and take appropriate enforcement • Enhance effectiveness in oversight of state enforcement programs and initiate supportive federal enforcement actions • Seek to ensure that all CAFOs that discharge or propose to discharge obtain National Pollutant Discharge Elimination system (NPDES) permit coverage. Reference: The Next Generation of Tools and Actions to Restore Water Quality in the Chesapeake Bay. www.executiveorderchesapeakebay.net Page A-3, A-4
Compliance and Enforcement RoleEnforcement Tools Currently Available • With other EPA, state, and federal partners, engage in education and outreach to the CAFO community about statutory and regulatory requirements • Target cleanup activities at hazardous waste sites identified as contribution to specific impairments to water quality in the Bay Reference: The Next Generation of Tools and Actions to Restore Water Quality in the Chesapeake Bay. www.executiveorderchesapeakebay.net Page A-3, A-4
EPA Letter (Dec. 29, 2009) to Honorable Preston BryantSecretary of Natural Resources • EPA Region 3, Shawn M. Garvin, Regional Administrator • Bay Program Accountability Framework • EPA Expected Deliverables and Triggers for Federal Action • Potential Federal Actions
Potential Federal Actions(EPA Region 3 Letter-29 Dec 2009) • Expand NPDES permit coverage to currently unregulated sources • Object to NPDES permits and increase program oversight • Require net improvement offsets • Establish finer scale wasteload and laod allocations in the Bay TMDL • Require additional reductions of loadings from point sources
Potential Federal Actions(EPA Region 3 Letter-29 Dec 2009) • Increase and target federal enforcement and compliance assurance in the watershed • Condition or redirect EPA grants • Federal promulgation of local nutrient water quality standards
What does the mean? • Animal feeding operations • May be subject to increased regulation • Nutrient management plans may be required for smaller operations • Current planning process in VA is detailed, inflexible, and usually difficult to totally implement and maintain up-to-date. • Follow this process carefully to see how individual farms may be affected. • Grain, forage, vegetable, turf, tree, and ornamental plant production • More nutrient management plans may be required as the Bay model uses “acres under nutriment management plans” as an indicator of reduction in nutrient losses to water • Implementation?
Water Quality Legislation • Review the details • Categorize positives and negatives • Contact your legislators • Specific comments • Economic impact of specific requirements carry weight with legislators and their staff • Work with farm organizations • establish positions and communicate to legislators and government agency personnel
Farm Sustainability • Economic • Productivity • Environmental
Efficiency • Yield levels that cover • fixed costs and provide • for profits • Land cost • Input cost • Technology that maximizes the • use of all inputs
Producer SurveyShenandoah Valley Watershed What is your most frequently used source of information for crop production information? (RANK in order of importance) • Seed/Fertilizer/Crop Protection Advisor ---------- S/F/CPA • Feed/Nutrition Advisor ------------------------------F/NA • Cooperative Extension ------------------------------- Coop Ext. • DCR Personnel --------------------------------------- DCR • NRCS Personnel -------------------------------------- NRCS • Soil & Water Conservation Service Personnel --- S&WC • Neighbor/Other Farmer ------------------------------ Neighbor • Other --------------------------------------------------- Other
Producer Response to “Source of Information” 63 responses
Technology Development and Implementation • Research Examples – Basic and applied • Genetics – Traits • Nutrition • Plant protection • Implementation • Regions • Soils • Production Systems • Issue • Who will do this in the future?
Farm Sustainability • Economic • Productivity • Environmental