Download

1 / 25
250 likes | 256 Views
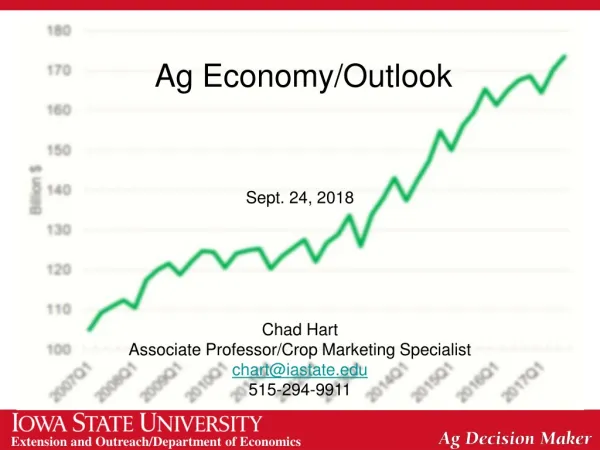
Ag Outlook. June 7, 2017 Chad Hart Associate Professor/Crop Marketing Specialist chart@iastate.edu 515-294-9911. Ag Productivity and Usage. Using corn as an example. Source: USDA. Ag Prices. Using corn as an example. Source: USDA. Net Farm Income. Source: USDA. Farm Debt.

E N D
Ag Outlook June 7, 2017 Chad Hart Associate Professor/Crop Marketing Specialist chart@iastate.edu 515-294-9911
Ag Productivity and Usage Using corn as an example Source: USDA
Ag Prices Using corn as an example Source: USDA
Net Farm Income Source: USDA
Farm Debt Source: Federal Reserve
Ag Economic Summary • Agricultural production and consumption has grown rapidly over the past several years. • But when production exceeds consumption, prices fall. • Crop revenues peaked in 2012-13, while livestock revenues crested in 2014-15, leading to record farm incomes. • Since then net farm income has been cut in half. • While the percentage loss in substantial, net farm income remains above levels from the early 2000’s. • Farmers and ranchers have partially compensated for the loss in income by taking on higher debt loads. • Farm and ranch balance sheets are eroding and financial stress is building for some producers, but the financial issues are not as severe as during the 1980’s. • If agricultural prices slowly improve (as projected), the squeeze on farm finances will improve as well. But for some producers, the squeeze may be too much.
AVERAGE VALUES all farmland 1941−2016 $7,183 As of Nov. 16 -5.9%
A replay of 1920s or 1980s farm crisis? Source: USDA-ERS, Ag DM C2-70, Zhang and Beek (2016) Farm Policy Journal
President’s Budget Request Source: OMB, 2018 Budget
USDA’s Budget Source: USDA 2017 Budget
Proposed Adjustments in Farm Policy Source: OMB, 2018 Budget
U.S. Corn Supply and Use Source: USDA-WAOB
U.S. Soybean Supply and Use Source: USDA-WAOB
World Corn Production Source: USDA-WAOB
World Soybean Production Source: USDA-WAOB
U.S. Meat Trade Million pounds Source: USDA-WAOB
Corn Export Sales Source: USDA-FAS
Soybean Export Sales Source: USDA-FAS
Current Corn Futures 4.02 3.87 3.48 Source: CME Group, 5/30/2017
Current Soybean Futures 9.47 9.19 9.11 Source: CME Group, 5/30/2017
Thank you for your time!Any questions?My web site:http://www2.econ.iastate.edu/faculty/hart/Iowa Farm Outlook:http://www2.econ.iastate.edu/ifo/Ag Decision Maker:http://www.extension.iastate.edu/agdm/