Download
1 / 13
130 likes | 130 Views
This study analyzes the spectral solar irradiance data collected by the VIRGO sunphotometers to determine the variations over solar cycle 23. The data cover a full cycle from February 1996 until present. The results are compared to SIM/SORCE results at these wavelengths and conclusions are drawn.

E N D
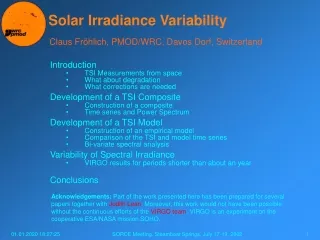
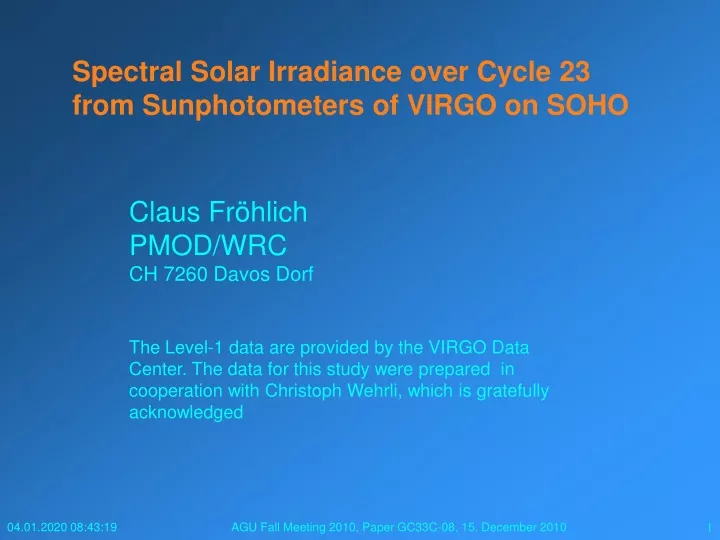
Spectral Solar Irradiance over Cycle 23 from Sunphotometers of VIRGO on SOHO Claus Fröhlich PMOD/WRC CH 7260 Davos Dorf The Level-1 data are provided by the VIRGO Data Center. The data for this study were prepared in cooperation with Christoph Wehrli, which is gratefully acknowledged AGU Fall Meeting 2010, Paper GC33C-08, 15. December 2010
Outline • VIRGO SPM Data description • How can we deduce a reasonable measure of the solar cycle variations from SPMB, the backup instrument • How to transform this information to the SPMA, the continuously exposed instrument • How do these results compare to the SIM/SORCE results at these wavelengths • Conclusions AGU Fall Meeting 2010, Paper GC33C-08, 15. December 2010
SPM Characteristcs • The three-channel Filterradiometers (called psunphometers) provide spectral irradiance data at three wavelengths with a bandpass of about 5 nm AGU Fall Meeting 2010, Paper GC33C-08, 15. December 2010
SPM Database from VIRGO/SOHO The data cover a full solar cylce from Feb.1996 until present AGU Fall Meeting 2010, Paper GC33C-08, 15. December 2010
Temperature dependence of sensitivity for SPMA AGU Fall Meeting 2010, Paper GC33C-08, 15. December 2010
Temperature dependence of sensitivity for SPMB AGU Fall Meeting 2010, Paper GC33C-08, 15. December 2010
How to deal with degradation? For the time dependent dose we have three terms: m(t) for the irradiance, the next is the Boltzman factor and the third the recovery during the time between the exposure. AGU Fall Meeting 2010, Paper GC33C-08, 15. December 2010
Decompose TSI record to use as proxy for the cycle variation of RGB AGU Fall Meeting 2010, Paper GC33C-08, 15. December 2010
Now we have everything to build the function to be fitted to the data AGU Fall Meeting 2010, Paper GC33C-08, 15. December 2010
Results of the fitting SPMB Tsi scaled for RED: 0.429 (Smode + 1.020 SSpot + 1.506 SFaculae) Tsi scaled for GREEN: 1.286 (Smode + 1.272 SSpot + 2.044 SFaculae) Tsi scaled for BLUE: 2.563 (Smode + 0.873 SSpot + 1.383 SFaculae) AGU Fall Meeting 2010, Paper GC33C-08, 15. December 2010
Now correct SPMA and compare to SIM AGU Fall Meeting 2010, Paper GC33C-08, 15. December 2010
Conclusions • The degradation correction are not yet optimal – it still needs to be improved • The correlation with decomposed TSI provides interesting insights in the differences and similarities of the three colours and TSI • All three channels are positively correlated with the solar cycle and their amplitudes are relative to TSI 0.50, 1.85 and 2.78 for RGB • The comparison with SIM is quite good in the blue, somewhat less in the red and different in the green. AGU Fall Meeting 2010, Paper GC33C-08, 15. December 2010
This presentation is available from ftp://ftp.pmodwrc.ch/pub/Claus/AGU_Fall2010/GC33C-08.ppt. Thanks AGU Fall Meeting 2010, Paper GC33C-08, 15. December 2010