Download
1 / 40
400 likes | 737 Views
FORAGING. Diet Selection Models. ASK THE FOLLOWING QUESTION:. 1. WHAT FOOD ITEMS SHOULD A FORAGER EAT?. Imagine a predator seeking prey:. Finds either prey type. Eat?? Move on??. Currency: Maximize rate of energy intake. The RULES!!!. 1. We can measure some standard currency.

E N D
Diet Selection Models ASK THE FOLLOWING QUESTION: 1. WHAT FOOD ITEMS SHOULD A FORAGER EAT? Imagine a predator seeking prey: Finds either prey type Eat?? Move on?? Currency: Maximize rate of energy intake
The RULES!!! 1. We can measure some standard currency 2. There is a cost in handling prey 3. A predator can’t handle one prey and search for another at the same time. Predator knows all this 4. Prey are encountered sequentially 5. Prey are recognized instantly and accurately
1. WHAT FOOD ITEMS SHOULD A FORAGER EAT? ei = energy provided by prey type i hi = handling time and effort associated with prey type i li = encounter rate with prey type i Ts = amount of time devoted to searching for prey type i T = total time For this example, we will assume that there are two prey types.
1. WHAT FOOD ITEMS SHOULD A FORAGER EAT? Assume predator always take prey with the higher ei/hi value i.e. a more favourable energy gain : handling effort ratio Low ei/hi value Higher ei/hi value
1. WHAT FOOD ITEMS SHOULD A FORAGER EAT? Assume predator always take prey with the higher ei/hi value Assume that the higher ei/hi value is prey type 1 (or e1/h1) Question : Should forager take prey 1 alone or take prey 1 and 2 as they are encountered?
1. WHAT FOOD ITEMS SHOULD A FORAGER EAT? Begin by calculating the total energy (E) per unit time associated with prey 1 Total energy obtained from prey 1 Tsl1e1 E = T Ts + Tsl1h1 Total handling time + Search time l1e1 E = Simplifies to T 1+ l1h1
1. WHAT FOOD ITEMS SHOULD A FORAGER EAT? Now calculate the total energy (E) per unit time associated both prey 1 and 2 Ts (l1e1 + l2e2) E = T Ts + Tsl1h1 + Tsl2h2 l1e1 + l2e2 E = Simplifies to T 1+ l1h1 + l2h2
1. WHAT FOOD ITEMS SHOULD A FORAGER EAT? Should a predator each both types of prey or just prey 1? Mathematically, a predator should eat prey 1 if the following is true l1e1 l1e1 + l2e2 > 1+ l1h1 1+ l1h1 + l2h2
1. WHAT FOOD ITEMS SHOULD A FORAGER EAT? Should a predator each both types of prey or just prey 1? Mathematically, a predator should eat prey 1 if the following is true l1e1 l1e1 + l2e2 > Holds true when 1+ l1h1 1+ l1h1 + l2h2 e2 > l1 e1h2 - e2h1
1. WHAT FOOD ITEMS SHOULD A FORAGER EAT? Should a predator each both types of prey or just prey 1? e2 > l1 e1h2 - e2h1 Two predictions: 1. Once a critical encounter rate with prey 1 is reached, it alone should be taken 2. The decision about whether or not to take prey 2 does not depend on how common it is (i.e. it’s encounter rate)
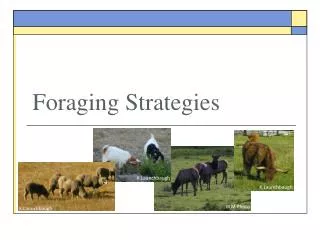
Patch Models Most food has a clumped distribution (or exists in patches)
PATCH MODELS HOW LONG SHOULD A FORAGER STAY IN A CERTAIN PATCH? Problem : Imagine a hummingbird on a flower ? ? ? ? ?
2. HOW LONG SHOULD A FORAGER STAY IN A CERTAIN PATCH? Charnov - Marginal Value Theorem - to determine how long an animal should stay in a patch Net food intake • • T2 T1 t1 t2 Time between patches Time in patch
2. HOW LONG SHOULD A FORAGER STAY IN A CERTAIN PATCH? Charnov - Marginal Value Theorem - to determine how long an animal should stay in a patch From previous graph: If there is a longer time between patches, you should spend more time in a patch (the t1: T1 situation). If there is a shorter time between patches, you should spend less time in a patch (thet1: T1situation).
Modifications to Optimal Foraging Models Central Place Foraging Cost - energy returning from feeding area -carrying load of food Nesting area Feeding area Cost - energy getting to feeding area
FORAGING STARLINGS 400 times/day How many insects should the parent take/trip?
How many insects should the parent take/trip? Reproductive success Size of the load Rate of delivery of food Survival of young First prey – retrieved easily Later prey – retrieved less easily – prey already in beak Yields a ‘loading’ or ‘gain’ curve Load Searching time
How many insects should the parent take/trip? Give up too early? – lots of travelling time for a small load Give up too late? – spend time in ineffective search 7 prey 8 prey 1 prey Optimum Travelling time Searching time
How many insects should the parent take/trip? What happens if we change the travel time? Short travel time Long travel time Optimum for short travel time Optimum for long travel time Travelling time Searching time
We did three things in formulating this model 1. Assumed starlings are good parents and will maximize energy delivery 2. Made a guess about the proper currency (max. net rate of food delivery) 3. Specified constrains – shape of load curve and travel time
Another example – Honey bee – Apis mellifera Number of flowers visited (= number of loads) Interflower time (= increase in carrying effort)
Sarcophaga mating behaviour % eggs fertilized Time in copula
Sarcophaga % eggs fertilized Predicted Actual 156 min Time in copula Time spent searching and guarding
Economics of food type Shore crabs – choice of different sized mussels Profitability Percentage of diet 1.0 2.0 3.0 1.0 2.0 3.0 Size of mussel Size of mussel
Economics of food type Shore crabs – choice of different sized mussels Why this choice? Very large prey – very long time and energy to open Net gain is lower Very small prey – easy to open but little energy Why do they sometimes take less preferred prey?
Why do they sometimes take less preferred prey? Large prey – contain E1 energy with handling time of h1 Small prey – contain E2 energy with handling time of h2 So, the profitability (energy gain/unit handling time) E1 h1 E2 h2 > - Large prey are more profitable
How does predator choose prey to maximize E/h? • If encounter prey 1, always eat it. • choice of more profitable prey doesn’t depend on the abundance of prey 2 b) If encounter prey 2, should eat it if gain from eating prey 2 > gain from rejecting and searching for more profitable prey. E2 h2 E1h2 E2 E1 S1 + h1 - h1 > > S1 or Choice of prey 2 (less profitable) depends on the abundance of prey 1(as expressed by S1)
Three predictions • Predator should either • a) Just eat prey 1 (specialize) • b) Eat both (generalize) 2) Decision to specialize depends on S1 and not S2 3) Switch from specialist to generalist – should be sudden - occur when S1 increases to the point where the equation is true
Extension of the Argument So far – considered efforts of single animals What happens when competition is involved? Scenario: Two habitats – one rich in resources, one poor No territoriality, no fighting
As more competitors occupy rich habitat – deplete resources Rich habitat Reward/individual Poor habitat Reward is same in both Number of competitors PREDICTION: Competitors adjust their distribution so that all individuals have the same rate of resource acquisition.
IDEAL FREE DISTRIBUTION -animals are FREE to go where they want -animals are IDEAL in having complete information about resource availability
IDEAL FREE DISTRIBUTION Two experiments Sticklebacks Daphnia Daphnia x 2 End A End B
IDEAL FREE DISTRIBUTION Two experiments Sticklebacks predicted 4 Number of fish at end A 2 Introduce at rate x 0 Switch to rate 2x Time (min)
IDEAL FREE DISTRIBUTION Two experiments Mallards predicted Number of ducks at site A predicted Time after start of experiment
IDEAL FREE DISTRIBUTION Mating in Sarcophaga
Expectation Relative numbers of males at each patch Expected number of arriving females Number of males on pat Male mating success Time after pat deposition Staying time