Download
1 / 49
510 likes | 807 Views
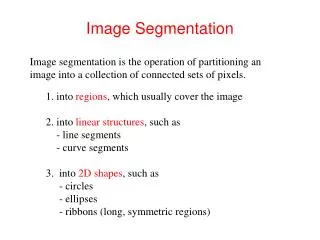
Image-Based Segmentation of Indoor Corridor Floors for a Mobile Robot. Yinxiao Li and Stanley T. Birchfield Department of Electrical and Computer Engineering Clemson University { yinxial, stb }@clemson.edu . Motivation. Goal: Segment the floor in a single corridor image. Why?

E N D
Image-Based Segmentation of Indoor Corridor Floors for a Mobile Robot Yinxiao Li and Stanley T. Birchfield Department of Electrical and Computer Engineering Clemson University { yinxial, stb }@clemson.edu
Motivation Goal: Segment the floor in a single corridor image • Why? • obstacle avoidance • mapping • autonomous exploration and navigation
Motivation Goal: Segment the floor in a single corridor image • Why? • obstacle avoidance • mapping • autonomous exploration and navigation
Outline • Previous Work • Detecting Line Segments • Score Model for Evaluating Line Segments • Structure Score • Bottom Score • Homogeneous Score • Experimental Results • Conclusion
Outline • Previous Work • Detecting Line Segments • Score Model for Evaluating Line Segments • Structure Score • Bottom Score • Homogeneous Score • Experimental Results • Conclusion
Previous Work Free space detection Floor detection Apply planar homographies to optical flow vectors (Kim 2009, Zhou 2006) Stereo homographies (Fazl-Ersi 2009) Geometric reasoning (Lee 2009) • Combination of color and histogram (Lorigo 1997) • Optical flow (Stoffler 2000, Santos-Victor 1995) • Stereo matching (Sabe 2004) • Limitations • Multiple images for motion • Multiple cameras for stereo • Require different colors for floor and wall • Computational efficiency • Calibrated cameras • Assume ceiling visible Our contribution: Segment the floor in real time using a single image captured by a low-height mobile robot
Challenging problem: Reflections • Also: • variety of poses (vanishing point, ceiling not always visible) • sometimes wall and floor color are nearly the same
Outline • Previous Work • Detecting Line Segments • Score Model for Evaluating Line Segments • Structure Score • Bottom Score • Homogeneous Score • Experimental Results • Conclusion
Douglas-Peucker Algorithm • Purpose: Reduce the number of points in a curve (polyline) Algorithm: • Connect farthest endpoints • Repeat • Find maximum distance between the original curve and the simplified curve • Split curve at this point Until max distance is less than threshold David Douglas & Thomas Peucker, "Algorithms for the reduction of the number of points required to represent a digitized line or its caricature", The Canadian Cartographer 10(2), 112–122 (1973)
Douglas-Peucker Algorithm • Purpose: Reduce the number of points in a curve (polyline) Algorithm: • Connect farthest endpoints • Repeat • Find maximum distance between the original curve and the simplified curve • Split curve at this point Until max distance is less than threshold
Douglas-Peucker Algorithm • Purpose: Reduce the number of points in a curve (polyline) Algorithm: • Connect farthest endpoints • Repeat • Find maximum distance between the original curve and the simplified curve • Split curve at this point Until max distance is less than threshold
Douglas-Peucker Algorithm • Purpose: Reduce the number of points in a curve (polyline) Algorithm: • Connect farthest endpoints • Repeat • Find maximum distance between the original curve and the simplified curve • Split curve at this point Until max distance is less than threshold
Douglas-Peucker Algorithm • Purpose: Reduce the number of points in a curve (polyline) Algorithm: • Connect farthest endpoints • Repeat • Find maximum distance between the original curve and the simplified curve • Split curve at this point Until max distance is less than threshold
Douglas-Peucker Algorithm • Purpose: Reduce the number of points in a curve (polyline) Algorithm: • Connect farthest endpoints • Repeat • Find maximum distance between the original curve and the simplified curve • Split curve at this point Until max distance is less than threshold
dallowed Modified Douglas-Peucker Algorithm original algorithm: dallowed is constantmodified algorithm: dallowed is given by half-sigmoid function original modified
Detecting Line Segments (LS) Compute Canny edges
dallowed Detecting Line Segments (LS) • Compute Canny edges • Modified Douglas-Peucker algorithm to detect line segments • Vertical LS: slope within ±5° of vertical direction • Horizontal LS: Slope within ±45° of horizontal direction
dallowed Detecting Line Segments (LS) • Compute Canny edges • Modified Douglas-Peucker algorithm to detect line segments • Vertical LS: slope within ±5° of vertical direction • Horizontal LS: Slope within ±45° of horizontal direction • 3. Pruning line segments (320x240) • Vertical LS: minimum length 60 pixels • Horizontal LS: minimum length 15 pixels • Vanishing point (height selection):The vanishing point is computed as the mean of the intersection of pairs of non-vertical lines. It is used for throwing away horizontal line segments coming from windows, ceiling lights, etc.
Outline • Previous Work • Detecting Line Segments • Score Model for Evaluating Line Segments • Structure Score • Bottom Score • Homogeneous Score • Experimental Results • Conclusion
Score Model Weights horizontal line Bottom Score Structure Score Homogeneous Score • is assigned to each horizontal line
Score Model – Structure Given a typical corridor image |I(x,y)| > T1(How to set threshold T1?) |I(x,y)| > T1
Score Model – Structure Given a typical corridor image |I(x,y)| > T1(gradient magnitude)(How to set threshold T1?) I(x,y) < T2(image intensity) (How to set threshold T2?) |I(x,y)| > T1 and I(x,y) < T2
Score Model – Structure Given a typical corridor image |I(x,y)| > T1(gradient magnitude)(How to set threshold T1?) I(x,y) < T2(image intensity) (How to set threshold T2?) We applied SVM to 800 points in 200 images: |I(x,y)| > T1 and I(x,y) < T2
Score Model – Structure Given a typical corridor image |I(x,y)| > T1(gradient magnitude)(How to set threshold T1?) I(x,y) < T2(image intensity) (How to set threshold T2?) Approximate using two thresholds: |I(x,y)| > T1 and I(x,y) < T2
Score Model – Structure Given a typical corridor image |I(x,y)| > T1(gradient magnitude) I(x,y) < T2(image intensity) Now threshold original image using TLC (average gray level of pixels satisfying #1 and #2) I(x,y) < TLC
Score Model – Structure Given a typical corridor image |I(x,y)| > T1(gradient magnitude) I(x,y) < T2(image intensity) Now threshold original image using TLC (average gray level of pixels satisfying #1 and #2) Compute the chamfer distance between the line segments and structure blocks
Score Model – Structure Comparison of different threshold methods Ridler-Calvard Otsu Our method is able to remove the spurious pixels on the floor caused by reflections or shadows Our method
Outline • Previous Work • Detecting Line Segments • Score Model for Evaluating Line Segments • Structure Score • Bottom Score • Homogeneous Score • Experimental Results • Conclusion
Score Model – Bottom Connect the bottom points of consecutive vertical line segments to create “bottom” wall-floor boundary
Score Model – Bottom Connect the bottom points of consecutive vertical line segments to create “bottom” wall-floor boundary
Score Model – Bottom Connect the bottom points of consecutive vertical line segments to create “bottom” wall-floor boundary Compute the distance of each horizontal line segment to the “bottom” wall-floor boundary (red circled horizontal line segments indicates a positive contribution)
Outline • Previous Work • Detecting Line Segments • Score Model for Evaluating Line Segments • Structure Score • Bottom Score • Homogeneous Score • Experimental Results • Conclusion
Score Model – Homogeneous Idea: The floor tends to have larger regions (due to decorations, posters, windows on the wall). Algorithm: Color-based segmentation of the image (using Felzenszwalb-Huttenlocher’s minimum spanning tree algorithm) For each horizontal line segment, compute size of region just below segment size of largest segment
Score Model – Homogeneous Idea: The floor tends to have larger regions (due to decorations, posters, windows on the wall). Algorithm: Color-based segmentation of the image (using Felzenszwalb-Huttenlocher’s minimum spanning tree algorithm) For each horizontal line segment, compute size of region just below segment size of largest segment
Segmenting the floor Normalize the scores and sum Threshold the final score: Connect the remaining line segments and extend the endpoints to the edges of the image
Outline • Previous Work • Detecting Line Segments • Score Model for Evaluating Line Segments • Structure Score • Bottom Score • Homogenous Score • Experimental Results • Conclusion
Evaluation Criterion • Wall- floor Boundary • Green line: Detected wall-floor boundary • Red line: Ground truth
Evaluation Criterion • Wall- floor Boundary • Green line: Detected wall-floor boundary • Red line: Ground truth • Area • Blue shade area: misclassified area • Red shade area: ground truth floor area • Error Rate • Segmentation is considered successful if rerr < 10%
Sample Results 89.1% success on database of 426 images:
Sample Results Images downloaded from the internet:
Sample Results Lee’s Original Image Ours Some successful results on failure examples from Lee et al. 2008 D. C. Lee, M. Hebert, and T. Kanade. “Geometric Reasoning for Single Image Structure Recovery”. IEEE Conference on Computer Vision and Pattern Recognition (CVPR), 2009.
Sample Results Textured wall Checkered floor Dark image Bright lights Failure examples
Sample Results Video clip 1
Sample Results Video clip 2
Outline • Previous Work • Detecting Line Segments • Score Model for Evaluating Line Segments • Structure Score • Bottom Score • Homogeneous Score • Experimental Results • Conclusion
Conclusion • Summary • Edge-based approach to segmenting floors in corridors • Correctly handles specular reflections on floor • Nearly 90% of the corridor images in our database can be correctly detected. • Speed: approximately 7 frames / sec • Future work • Speed up the current algorithm • Improving score model by add more visual cues(highly textured floors, low resolution, or dark environment) • Use floor segmentation for mapping
Acknowledgement • Clemson Computer Vision Group reviewers • Zhichao Chen • Vidya Murali • Anonymous reviewers
Thanks! Questions? Image-Based Segmentation of Indoor Corridor Floors for a Mobile Robot