Download
1 / 12
120 likes | 226 Views
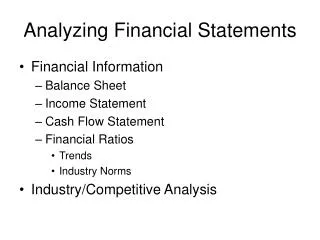
Analyzing Financial Data. Ratio Analysis. Lesson Components. Four Key Financial Statements Ratio Overview Ratio Categories Liquidity Activity Debt Profitability Market Practice. Four Key Financial Statements.

E N D
Analyzing Financial Data Ratio Analysis
Lesson Components • Four Key Financial Statements • Ratio Overview • Ratio Categories • Liquidity • Activity • Debt • Profitability • Market • Practice
Four Key Financial Statements Each corporation is required to file with the Securities and Exchange Commission (SEC) four key financial statements: • Income statement: • provides a financial summary of the company’s operating results over a specified period of time. • Balance sheet: • provides a summary statement of the company’s financial position at a given point in time. • Statement of Stockholders’ Equity: • shows all the equity account transactions in a given year. • Statement of Cash Flows: • summary of cash flows of a given period of time.
Learning Statements • These financial statements are also used in order to do ratio analysis to examine the performance of a firm. Income Statement Sample Accounts Sales COGS Operating Expenses Selling Expenses Interest Expense Earnings before Interest & Taxes (EBIT) Net Income Balance Sheet Sample Accounts Cash Accounts Payable Accounts Receivable Notes Payable InventoriesAccruals Total Current Assets Total Current Liability Land and Buildings Preferred Stock Machinery & Equipment Common Stock Vehicles Retained Earnings
Ratio Overview • Many internal and external stakeh0lders use ratios • A ratio is not enough information on its own. • Several limitations exist to ratio analysis • Seasonality • Inflation • Summarization • Asset valuation
Five Categories of Ratios • Liquidity • Activity • Debt • Profitability • Market
Liquidity Ratios Liquidity is the company’s ability to pay its short-term bills Current ratio Current assets/Current liabilities $72,000/$69,000 = ??? Quick ratio Current assets-inventory/Current liabilities $72,000-45,500/$69,000 =???
Activity Ratios Activity is a measure of how quickly the firm’s current assets are converted into cash. Inventory Turnover COGS /Avg Inventory $106,000/ $45,500=??? Average Collection Period Accts rec/(Annual sales/365) $25,000/(160,000/365)=??? Total Asset Turnover Sales/ Total Assets $160,000 $150,000=???
Used to determine whether the firm is able to meet long-term financial obligations. Debt Ratios Debt Ratio Total liabilities/ Total assets $91,950/ $150,000 =??? Times Interest Earned Ratio EBIT/ Interest expense $17,000/ 6,100 =???
Measure how well management is utilizing company resources to earn a return on the funds invested by various groups Profitability Ratios Gross Profit Margin (Sales-COGS)/ Sales ($160,000-106,000)/$160,000 =?? Operating Profit Margin EBIT or Operating Income/Sales $17,000/160,000=?? Net Profit Margin Net Income/Sales $6,540/160,000=?? Earnings per Share Net Income/Shares Outstanding $6,540/3,000=?? Return on Total Assets Net Income/ Total Asset $6,540/150,000=?? Return on Equity Net Income/Shareholder Equity $6,540/31,500=??
This set measures how well the firm is doing in terms of the stock price and risk and return Market Ratios Price Earnings Ratio Market price per share common stock/ EPS $25/$2.18 = ??? Market/Book Ratio Market price per share common stock/(Shareholder Equity/shares outstanding) $25/($31,500/3000) =???
Check Your Understanding Which of the following measure a company’s liquidity without considering inventory? a. Current ratio b. Rapid test ratio c. Quick ratio d. Inventory ratio