Download

1 / 31
310 likes | 323 Views
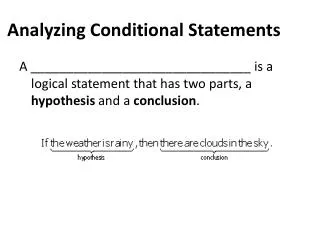
Analyzing Financial Statements. Chapter 23. Preparing comparative balance sheets. Learning Objective 1. Comparative Balance Sheets. Assets 20x8 20x7 Change % Current Assets: Cash $ 3,040 $ 4,080 $(1,040) (25.5)

E N D
Analyzing Financial Statements Chapter 23
Preparing comparative balance sheets. Learning Objective 1
Comparative Balance Sheets Assets 20x8 20x7 Change % Current Assets: Cash $ 3,040 $ 4,080 $(1,040) (25.5) Accounts Receivable Net 20,000 16,000 4,000 25.0 Merchandise Inventory 24,160 26,120 (1,960) (7.5) Prepaid Expenses 80,000 60,000 200 33.3 Total Current Assets $ 48,000 $ 46,800 $ 1,200 2.6 Plant and Equipment Office Equipment, Net $125,200 $116,800 $ 8,400 7.2 Total Assets $173,200 $163,600 $ 9,600 5.9
Comparative Balance Sheets Liabilities 20x8 20x7 Change % Current Liabilities: Notes Payable $20,960 $17,320 $3,640 21.0 Accounts Payable 240 280 (40)(14.3) Total Current Liabilities $21,200 $17,600 $3,600 20.5 Long-Term Liabilities: Mortgage Payable $60,000 $60,000 -0- -0- Total Liabilities $81,200 $77,600 $3,600 4.6
Comparative Balance Sheets Stockholders’ Equity 20x8 20x7 Change % Common Stock, $10 par $ 60,000 $ 60,000 -0- -0- Retained Earnings 32,000 26,000$6,00023.1 Total Stockholders’ Equity $ 92,000 $ 86,000 $6,000 7.0 Total Liabilities and Stockholders’ Equity $173,200$163,600$9,600 5.9
Using horizontal and vertical analysis techniques. Learning Objective 2
Learning Unit 23-1 What is horizontal analysis? • Comparative balance sheets are analyzed for percentages of change – increases or (decreases). • Compute the dollar change from the base period to the later period. • Divide the dollar change by the base period amount.
Learning Unit 23-1 20x8 20x7 Difference Cash $3,040 $4,080 $(1,040) $1,040 ÷ $4,080 = .2549, or 25.5%
Learning Unit 23-1 • Vertical analysis compares each item on a report to a base number set to 100%. • The base will be either total assets or total liabilities and stockholders’ equity on a balance sheet.
Learning Unit 23-1 Assets 20x8 % Current Assets: Cash $ 3,040 1.8 Accounts Receivable Net 20,000 11.5 Merchandise Inventory 24,160 13.9 Prepaid Expenses 800 .5 Total Current Assets $ 48,000 27.7 Plant and Equipment Office Equipment, Net $125,200 72.3 Total Assets $173,200 100.0
Learning Unit 23-2 • Comparative income statement changes are shown also as percentage increases or decreases. • In the case of the income statement, each item is shown as a percentage of net sales.
Learning Unit 23-2 20x8 % Net Sales $317,600 100.0 Cost of Goods Sold 198,000 62.3 Gross Profit from Sales $119,600 37.7 Total Operating Expenses 83,600 26.3 Operating Income $ 36,000 11.3 Less Interest Expense 4,200 1.3 Income Before Taxes $ 31,800 10.0 Income Taxes 15,900 5.0 Net Income $ 15,900 5.0
Learning Unit 23-2 • What is trend analysis? • It is a special type of horizontal analysis that deals with the percentage of changes in certain key items over several years. Trend % = Any year $ ÷ Base year $
Year 20x8 20x7 20x5 Sales $317,600 $302,000 $270,000 Cost of Goods Sold 198,000 194,000 142,000 Gross Profit $119,600 $108,000 $128,000 20x5 is the base year. Learning Unit 23-2 What are the trend percentages?
Year 20x8 20x7 20x5 Sales 118% 112% 100% Cost of Goods Sold 139% 137% 100% Gross Profit 93% 84% 100% Learning Unit 23-2
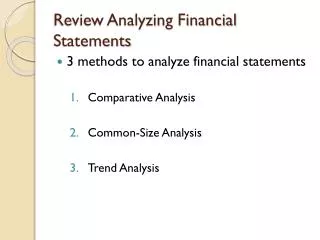
Calculating the four different types of ratios: liquidity ratios, asset management ratios, debt management ratios, and profitability ratios. Learning Objective 3
Learning Unit 23-3 • A ratio is the relationship of two quantities or numbers, one divided by the other. • Ratios can be compared over time for one business. • They also can be compared to readily available industry ratios.
Learning Unit 23-3 Liquidity Ratios Current ratio = Total current assets ÷ Total current liabilities Acid test ratio = (Current assets – Merchandise inventory – Prepaid expenses) ÷ Current liabilities
Learning Unit 23-3 • The current ratio indicates ability to pay short-term obligations. • The acid test, or quick, ratio shows availability of assets that can easily be converted to cash to pay current liabilities.
Learning Unit 23-3 Asset Management Ratios Accounts receivable turnover = Net credit sales ÷ Average accounts receivable Average collection period = 365 days ÷ Accounts receivable turnover
Learning Unit 23-3 Accounts receivable turnover shows how many times accounts receivable is converted to cash in one year.
Learning Unit 23-3 Inventory turnover = Cost of goods sold ÷ Average inventory Asset turnover = Net sales ÷ Total assets
Learning Unit 23-3 • The inventory turnover calculates the number of times inventory turns over in one period. • The asset turnover indicates whether or not assets have been used efficiently to generate sales.
Learning Unit 23-3 Debt Management Ratios Debt to total assets = Total liabilities ÷ Total assets Debt to stockholders’ equity = Total liabilities ÷ Stockholders’ equity
Learning Unit 23-3 • The debt-to-total-assets ratio indicates the amount of assets that are financed by creditors. • The debt-to-stockholders’-equity ratio shows stockholders’ risk compared to creditors’ risk.
Learning Unit 23-3 Times interest earned = Income before taxes and interest expense ÷ Interest expense It reveals ability to meet interest payment due dates.
Learning Unit 23-3 Profitability Ratios Gross profit rate = Gross profit ÷ Net sales Return on sales = Net income before taxes ÷ Net sales
Learning Unit 23-3 • The gross profit ratio indicates how much of the sales income is available to pay expenses and generate a net income. • A high return on sales ratio usually means that inventory consists of high priced items such as autos and furniture.
Learning Unit 23-3 Rate of return on total assets = Net income before interest and taxes ÷ Total assets Rate of return on common stockholders’ equity = (Net income before taxes – preferred dividends) ÷ Common stockholders’ equity
Learning Unit 23-3 • The rate of return on total assets indicates earning power. • The rate of return on common stockholders’ equity shows the amount of the net income share that remains for the common stockholders (after preferred dividends are deducted).