Download
1 / 39
390 likes | 495 Views
OXYGEN ION ACCELERATION AND CONVECTION IN THE POLAR MAGNETOSPHERE. B. Klecker for the CLUSTER Team at MPE G. Paschmann, B. Klecker, M. Förster, H. Vaith, J. Bogdanova, E. Georgescu, S. Haaland, P. Puhl-Quinn A. Blagau, A. Kis, H. Hasegawa, B. Sonnerup

E N D
OXYGEN ION ACCELERATION AND CONVECTION IN THE POLAR MAGNETOSPHERE B. Klecker for the CLUSTER Team at MPE G. Paschmann, B. Klecker, M. Förster, H. Vaith, J. Bogdanova, E. Georgescu, S. Haaland, P. Puhl-Quinn A. Blagau, A. Kis, H. Hasegawa, B. Sonnerup Presentation at the Fachbeirat MPE 2002 June 17 - 20, 2002
OUTLINE • The CLUSTER Mission and Payload • The Experiments EDI and CIS • Ion Convection Measurements: a Tool • to study spatial and temporal variations • to study wave signatures • to derive spatial scales from time series measurements • Summary
CLUSTER: CORNERSTONE #1 (WITH SOHO) OF ESA‘S SCIENTIFIC PROGRAM AND PART OF ISTP
THE ELECTRON DRIFT INSTRUMENT (EDI) Scientific Objectives Measurement of the ambient electric field by a novel technique developed over the last 20 years: Emission and subsequent detection of tracer electrons by two sets of electron gun / detector units, positioned at 180° to each other.
THE ELECTRON DRIFT INSTRUMENT (EDI) • For any combination of magnetic field B and drift velocity V, only a single electron trajectory exists that connects each electron gun with the detector located on the opposite side of the S/C. • Technique: • Emission of an electron beam of 1 keV perpendicular to the local magnetic field. • Detection of the electrons with the detector on the opposite side of the S/C. • Measurement of the times-of-flight, T1 T2. • Computation of E from the drift step d, and B • d = Vd Tg ~ E / B2 • T1,2 = Tg (1±Vd/Ve) • T1-T2 = 2 (d/Ve) • T1+T2 = 2 Tg = 4 me / e B
EDI: Triangulation and Time-of-Flight Technique • Triangulation Technique • By employing 2 beams and 2 detectors, the two unique directions can be monitored continuously and the displacement dobtained by a triangulation procedure. • Time-of-Flight Technique • When the magnetic field B becomes small, d ~ E/B2 becomes very large and cannot be determined accurately any more with the triangulation technique. Then d can be determined with higher precision from the time-of-flight differences. • T1-T2 = 2 (d/Ve)
EDI DATA PRODUCTS • Electric field time series • V^ time series Time resolution: ≥100 msec, standard 1 sec Limitations: magnetic field strength, typically B > 15 nT rapid time variations in E or B signal to background ratio data from S/C-1, S/C-2, S/C-3 Note: EDI provides V^ without any additional assumptions
THE CLUSTER ION SPECTROMETRY INSTRUMENT (CIS) • Scientific Objectives / Instrument Requirements • Determination of the 3D Distribution function of ions in the energy range ~ 0 (S/C-potential) to 40 keV/e with 1 spin (4 sec) time resolution. • Identification of major ions in the near-Earth plasma environment, i.e. of H+, He2+, He+, and O+. Technical solution to cover large dynamic range and to provide redundancy: 2 sensors with 2 geometry factors each (factor ~100 ) CIS-1 (CODIF) Composition and Distribution Function Analyzer • On-board analysis provides H+, He2+, He+, and O+. • Ground analysis provides in addition O2+ and O2+ • Energy range 0.020 - 40 keV/e + ~ 0 (S/C-potential) - 20 eV with RPA CIS-2 (HIA) Hot Ion Analyzer • Ion energy range 0.005 - 32 keV/e
CIS DATA PRODUCTS ON-BOARD ANALYSIS • Moments (N, V, T, P) computed onboard every spin (4 sec) from 3D distributions for H+, He2+, He+, O+ • 3D Distributions of H+, He2+, He+, O+ for ≥ 1 spin -> telemetry ANALYSIS ON GROUND • 3D Distributions of H+, He2+, He+, O+ with max. 1 spin resolution. • Moments (N, V, T, P) computed for selectable energy ranges. Limitations: Counting statistics Data from S/C-1, S/C-3, S/C-4 Plasma Drift / Convection: V^ derived from V and magnetic field B
PLASMA CONVECTION MEASUREMENTS Measurements with the 4 CLUSTER S/C provide a tool for the study of • Spatial and temporal variations • Spatial scales • Wave signatures
Typical Signatures of O+ Beams in the CUSP and Polar Cap • The velocity distribution of O+ shows a mono-energetic beam with systematic time dispersion. • For Bz < 0 the energy is systematically decreasing with increasing latitude. • The convection velocity inferred from the O+ velocity measurement and V^ as measured directly with EDI are in remarkably good agreement. • The pole-ward convection is consistent with the 2-cell convection patterns as typically observed in the ionosphere for Bz < 0 .
Oxygen Beams in the Cusp and Polar Cap • Interpretation • Localized (in latitude) source of accelerated ionospheric ions with broad energy spectrum. • Velocity, V, from super-position of outward particle motion (VII) with pole-ward convection (V^) Thisresults in an apparently mono-energetic beam as observed on CLUSTER
MULTISPACERAFT OBSERVATIONSCLUSTER CONFIGURATION ON MARCH 4, 2001
MULTISPACECRAFT MEASUREMENTS • Energy-time spectrogram of O+. • Number density of O+ on S/C 1, 3, 4. • V|| of O+ on S/C 1, 3, 4. • V^ of O+ on S/C 1, 3, 4. Note: • For separation distances of ~ 600 km the convection velocities are essentially identical on all 3 S/C. • Check for time-lag between different S/C provides length-scale of coherence of convection.
CROSS - CORRELATION: CIS CIS S/C-3 - S/C-4 Cross-correlation of V^ as measured with CIS with 16 s resolution. Maximum correlation is obtained for zero time lag.
CROSS - CORRELATION: EDI Cross-correlation of V^ as measured with EDI with 1 s resolution. Maximum correlation is obtained for zero time lag.
SUMMARY-1 • The convection velocities derived from the O+ moments are in remarkable agreement with the drift velocity measured directly with the EDI experiment onboard CLUSTER. Thus, the combination of CIS and EDI measurements provide a full set of 4 S/C measurements with redundancy (2 x S/C-1, S/C-2, 2 x S/C-3, S/C-4) • For separation distances of ~ 600 km the convection velocities are essentially identical on all spacecraft. This implies that the observed variations in V^ are temporal in nature, i.e. due to changes in the convection pattern probably caused by substorm related activity.
Energystep structures of O+ and H+ ions in the cusp and polar capO+ distribution functions, S/C 1 • At 02:25:20 the O+ distribution function shows a beam-like behavior, at 02:35:40 the distribution function shows high perpendicular heating.
NEXT STEPS Convected O+ Ions • Correlate variations in convection velocity with substorm activity. • Compare the O+ energy dispersion with model calculations (trajectory tracing). This method can be used, together with the information on the convection velocity, to infer the altitude distribution of ion injection and acceleration (e.g. Dubouloz et al., 2001, Bouhram et al., 2002). • Use the multi-spacecraft measurements to infer the latitude and longitude distribution of ion injection (for larger separation distances). Perpendicular Heating • Detailed correlation with wave measurements onboard Cluster
CONVERSION OF TIME SERIES DATA INTO SPATIAL PROFILES AT THE MAGNETOPAUSE • The 4 MP crossings provide the magnetopause orientation and velocity at discrete instances in time. • Continuous sensing of the magnetopause velocity is possible with the measurement of the plasma drift velocity made with EDI and CIS. Panel 3: VN, the drift velocity along the MP normal (EDI and CIS). • Integration of VN defines the distance from the MP to the S/C (Panel 4). • This distance scale can then be used to convert the time series data into a spatial profile.
STANDIG ULF WAVES IN THE POLAR REGION SUN • Phase shift between dB and dV = 90° • STANDING WAVE • Positive Pointing Flux • Energy Input into Ionosphere
UT 15:00 15:30 16:00 16:30 17:00 17:30 18:00 UT 15:00 15:30 16:00 16:30 17:00 17:30 18:00 UT 15:00 15:30 16:00 16:30 17:00 17:30 18:00 ILAT 61.80 64.90 70.70 77.40 83.50 88.40 87.70 ILAT 66.80 72.70 78.80 84.30 88.80 88.10 85.10 ILAT 66.20 73.00 79.90 85.80 89.50 86.30 83.70 MLT 12.20 12.30 12.40 12.40 12.30 11.00 01.80 MLT 12.40 12.50 12.60 12.70 12.80 00.90 00.90 MLT 12.40 12.50 12.70 12.90 23.40 00.40 00.80 STUDY OF TIME VARIATIONS CUSTER-CIS Day 30 - 08 - 2001 Ion C4 C4 C2 ZGSM C1 Ion C3 C1 XGSM Ion C3 From OVT 16 UT Tsy87, KP=3
12 VcCIS C3 SuperDarn MHD Cluster C3 Ion Geotail + 10mn IMF 15:00 15:30 16:00 16:30 17:00 17:30 18:00 Time UT (HH:MM)
C3 12 SuperDarn MHD Cluster C3 Ion Geotail + 10min IMF 15:00 15:30 16:00 16:30 17:00 17:30 18:00 Time UT (HH:MM)
Summary-2 • Double cusp observed when IMF turned from South to North and dominant IMF-By negative. • Second cusp observed on CLUSTER-3 is the cusp for Bz>0 that moved poleward. • CIS and EDI measurements of plasma convection in the polar region can be used to investigate in detail changes of the convection pattern in response to solar wind conditions.
C4 Start of cusp at C4,C2,C1 SuperDarn MHD simulation C3 C4,C2,C1 12 12
C3 12 SuperDarn MHD Cluster C3 Ion Geotail + 10min IMF 15:00 15:30 16:00 16:30 17:00 17:30 18:00 Time UT (HH:MM)
C3 12 SuperDarn MHD Cluster C3 Ion Geotail + 10min IMF 15:00 15:30 16:00 16:30 17:00 17:30 18:00 Time UT (HH:MM)
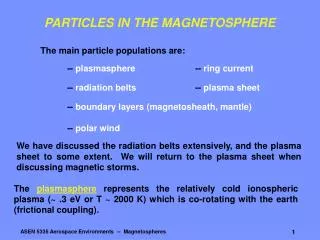
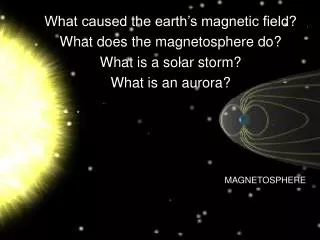
OBSERVATIONS • The dayside cusp region of the Earth‘s magnetosphere is known as a major source of ionospheric ions (e.g. Lockwood et al., 1985). • The study of these ions provides information on energization processes (e.g. transverse ion heating by electrostatic, electromagnetic waves, parallel acceleration by DC electric fields)
DMSP-F15 16:12 UT 15:30 16:18 DMSP-F15 17:52 UT 16:48
Sketch of cusp motion Cluster 3 Cusp Cleft/LLBL Bz<0, By<0 Bz>0, By<0
ONOING STUDIES Cusp: Magnetopause Tail
Energy step structures of O+ and H+ ions in the cusp and polar cap,Ions transverse heating mechanisms The heating can be associated with broadband extra low frequency (BBELF) wave fields,waves near the lower hybrid (LH) frequency, or electromagnetic ion cyclotron (EMIC) waves near 0.5 fH+. The heating can also be correlated with auroral electrons, suprathermal electron burst (STEBs), or precipitating H+ ions. Furthermore, types 1 and 2 are often associated with field-aligned currents.