Download
1 / 14
140 likes | 237 Views
Benefit and Cost Analyses of the Chesapeake Bay TMDL. Chesapeake Bay Program Office Kevin DeBell debell.kevin@epa.gov Office of Policy, National Center for Environmental Economics David Simpson simpson.david@epa.gov. What are We Trying to Do?.

E N D
Benefit and Cost Analysesof the Chesapeake Bay TMDL Chesapeake Bay Program Office Kevin DeBell debell.kevin@epa.gov Office of Policy, National Center for Environmental Economics David Simpson simpson.david@epa.gov
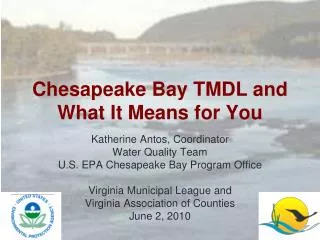
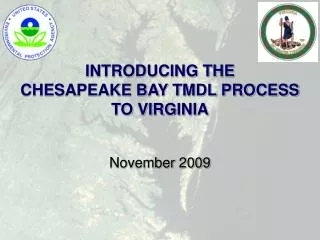
What are We Trying to Do? Develop an analysis of the total benefits and costs of the TMDL for the Chesapeake Bay watershed and for individual jurisdictions. Place benefits and costs of the TMDL into the context of the effort Bay watershed states have made over the years. Assist states in development of Phase II WIPs and subsequent analyses. Develop better methods for water quality improvement benefit estimation. Use transparent methodologies, data, and tools that can be easily employed in updates of this analysis.
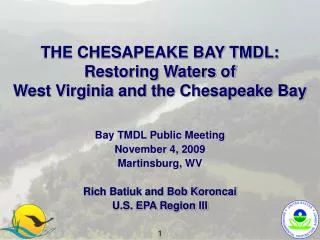
Progress • EPA is collecting and analyzing data for benefits and cost analyses. • EPA is providing extensive outreach to interested parties. • CBP advisory committees • Bay watershed jurisdictions • Environmental and other non-governmental organizations • EPA is coordinating with regional and national experts. • Benefits workshop • Coordination with outside projects, including USDA • Urban stormwater costs • Peer review
Benefit Estimation “In 2009, commercial fishermen in the Mid-Atlantic Region landed 696 million pounds of finfish and shellfish, earning $435 million in landings revenue.” National Marine Fisheries Service 2009 Regional Report for the mid-Atlantic Region How are facts like these related to “economic values”?
Revenues, surplus, and values Price of “fish” [NB: in a real example we’d be much more specific] Supply = what it cost to catch another fish 62.5 ¢/lb Demand = what consumers are willing to pay for another fish Revenue = $435 M 696 M lbs. Millions of pounds of fish landed
Economic benefits = “Surpluses” Price of “fish” [NB: in a real example we’d be much more specific] Supply = what it cost to catch another fish Consumer surplus = “What you would pay for it over and above what you do pay for it.” 62.5 ¢/lb Demand = what consumers are willing to pay for another fish Producer surplus = profit 696 M lbs. Millions of pounds of fish landed
How does water quality enter in? Price of “fish” [NB: in a real example we’d be much more specific] New supply: it’s easier to catch fish when there are more fish to catch 62.5 ¢/lb Economic benefit = increase in surplus Demand 696 M lbs. Millions of pounds of fish landed
Valuation principles • Total expenditures are poor guides to value. • Values are incremental; not “How much is water worth?” but “How much would it be worth to improve water quality by x relative to a baseline?” • You can almost never infer benefits with easily available data – it’s complicated! • Example was of shift in supply, in other cases it’s a shift in demand, or both • E. g., people may pay more for “healthier” fish.
Some misleading examples • Costanzaet al.’s famous “Value of natural capital and ecosystem services” provided a “serious understimate of infinity” (M. Toman) • The legendary 1989 MD study (“$1 trillion, after inflation”) is rife with errors: • Shipping through the Port of Baltimore has next to nothing to do with water quality • According to the study, the value of all real estate in MD would more than double. • Marylanders may spend more than $2B/year on recreational boating, but that’s not a valid estimate of water quality improvement benefits.
NCEE benefit estimation efforts:“Revealed preference” Commercial fishing Recreational fishing and other recreation Property values Avoided costs of water treatment & dredging Ecological co-benefits of BMPs
Anticipating some questions • “What about health effects?” • Partially reflected in other categories • We haven’t found evidence of wide-spread mortality/morbidity effects (except, possibly, from air quality?) • “What about jobs?” • We’re doing a parallel “impacts analysis”. • Are jobs a benefit or a cost? It depends. • “What about spillover effects?” • Generally effects in other markets would double-count effects already measured.
NCEE benefit estimation efforts:“Stated preference” • Some values cannot be inferred from observed behavior (= “revealed preference”) • What market transaction will reveal what you’d be willing to pay to save an endangered species? • To pass along a better world to your grandchildren? • To infer these values, we conduct surveys (= “stated preference”). • We’re on a very compressed timetable for this work, and have a literature review (= “benefit transfer”) backup plan.
Tentative Timeline December Responses from jurisdictions on unit costs January-February Development of draft cost analysis March-May Revisions based on Phase II WIPs Summer 2012 Peer review Fall 2012 Continued revisions and improvements December 2012 Delivery of analyses to DA Perciasepe