Download
1 / 50
500 likes | 663 Views
THE CHESAPEAKE BAY TMDL: Restoring Waters of DC and the Chesapeake Bay. Bay TMDL Public Meeting November 16, 2009 Washington, D.C. Katherine Antos and Bob Koroncai U.S. EPA Region III. 1. Click the double arrow to show or hide your control panel. Type your questions here.

E N D
THE CHESAPEAKE BAY TMDL: Restoring Waters of DC and the Chesapeake Bay Bay TMDL Public Meeting November 16, 2009 Washington, D.C. Katherine Antos and Bob Koroncai U.S. EPA Region III 1
Click the double arrow to show or hide your control panel • Type your questions here. (Indicate organization) Note: Because of the large audience, not all questions will be answered, but they will be saved, and your questions will help drive future events and could contribute to a FAQ. 2
Technical Issues? Contact: Citrix Global Customer Support 1-800-263-6317 3
AGENDA Welcome, introductions, and meeting logistics – Dr. Hamid Karimi, District Department of the Environment (5 minutes) EPA presentation on the Chesapeake Bay TMDL and EPA expectations – Katherine Antos and Bob Koroncai, EPA (45 minutes) Public comments, questions and answers – Panel moderated by Dr. Hamid Karimi (60 minutes) Panel includes: WASA; Anacostia Watershed Society; DDOE; Councilmember Tommy Wells, Ward 6 & LGAC Chair; EPA: Katherine Antos and Bob Koroncai; Council of Governments; Interstate Commission on the Potomac River Basin; Natural Resources Defense Council (invited) Adjourn 4
District of Columbia Water Quality Issues 9
Washington’s Potomac & Anacostia Rivers • DC tributaries to the Bay are: • Potomac River • Anacostia River • Rock Creek • Anacostia River is one of the three most polluted Chesapeake Bay tributaries. • Most of DC’s rivers and streams are impaired for one or more pollutants. • Sources in upstream jurisdictions contribute the majority of the pollutant loads to the District’s main waterbodies. 10
Washington’s Potomac & Anacostia Rivers Our major water quality issues are typical of all ultra urban waterbodies, they are: • Bacteria – from combined sewer overflows and stormwater runoff • Toxics – both coming from upstream, and legacy sediments in the Anacostia; a fish advisory is in effect in the District due to PCBs and PAHs. • Sediment – from construction sites & streambank erosion • Trash – will have its own DC TMDL soon • Nutrients – most nitrogen entering the Potomac River comes from Blue Plains advanced wastewater treatment plant • Low Dissolved oxygen – leading to habitat impairment and eutrophication. 11
Local Water Quality Issues Sediment from a nearby construction site entering Oxon Run of the Potomac River. 12
Local Water Quality Issues Stormwater velocity End results of excessive stormwater scouring: steep cliff erosion (undercut) is the result of too much stormwater coming too fast and scouring the stream banks in Oxon Run. 13
Local Water Quality Issues Trash on the Anacostia River banks Using a “Bandalong” trash device on the River to capture trash for disposal 14
Local Water Quality Issues Catfish w/tumor from toxics Toxic chemicals stored improperly – DDOE helps agencies to develop pollution prevention plans to contain toxics and prevent spills, discharges. Sewer lines that cross the river can leak via cracks and fissures – delivering bacteria to Watts Branch 15
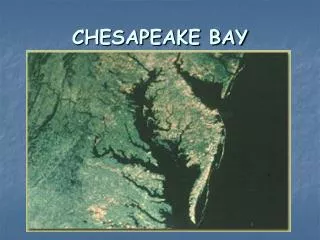
Chesapeake Bay Watershed-By the Numbers • Largest U.S. estuary • Six-states and DC, 64,000 square mile watershed • 10,000 miles of shoreline (longer then entire U.S. west coast) • Over 3,600 species of plants, fish and other animals • Average depth: 21 feet • $750 million contribution annually to local economies • Home to 17 million people (and counting) • 77,000 principally family farms • Declared “national treasure” by President Obama 17 Source: www.chesapeakebay.net
Nutrient Loads by State Nitrogen* Phosphorus *EPA estimates a nitrogen load of 284 million lbs nitrogen in 2008. EPA assumes a reduction of 7 million lbs due to the Clean Air Act. This leaves 77 millions lbs to be addressed through the TMDL process. 18
Nutrient Sources of the District of Columbia Sources of Phosphorus from DC Sources of Nitrogen from DC N and P values from 2008 Scenario of Phase 5.2 Watershed Model 19
Chesapeake Bay Health- Past and Future 20
Restored Bay Summary: 2008 Bay Health Assessment Priority Areas Water Quality 21% of Goals Achieved Habitats & Lower Food Web 45% of Goals Achieved Not quantified in relation to a goal Fish &Shellfish 48% of Goals Achieved Not quantified in relation to a goal Data and Methods: www.chesapeakebay.net/status_bayhealth.aspx 21
The Chesapeake Bay TMDL • EPA sets pollution diet to meet states’ Bay clean water standards • Caps on nitrogen, phosphorus and sediment loads for all 6 Bay watershed states and DC • States set load caps for point and non-point sources 23
The Bay science supports local pollution diets… Phase 4 Bay Watershed Model (2000-2008) Phase 5 Bay Watershed Model (2009- ) 24
…withdetailed representation of the District’s local watersheds 25
Taking Responsibility for Load Reductions Identify basinwide target loads EPA, States, DC Identify major basin by jurisdiction target loads EPA, States, DC Identify tidal segment watershed, county and source sector target loads States, DC, local governments & local partners 26
What are the Target Pollutant Cap Loads for the Bay Watershed? Current model estimates are that the states’ Bay water quality standards can be met at basinwide loading levels of: - 200 million pounds nitrogen per year - 15 million pounds phosphorus per year (Sediment target cap load under development-will be available by spring 2010) 27
Dividing the Basinwide Target Loading 28
Guidelines for Distributing the Basinwide Target Loads • Water quality and living resource goals should be achieved. • Waters that contribute the most to the problem should achieve the most reductions. • All previous reductions in nutrient loads are credited toward achieving final cap loads. 29
Current State Target Loads Nitrogen Phosphorus All loads are in millions of pounds per year. 31
DC’s Past, Present and Future Estimated Loads Nitrogen Phosphorus All scenarios run through Phase 5.2 Watershed Model 32
Target Load Refinements • If States’ Bay Water Quality Standards can still be achieved… • The State may exchange nitrogen and phosphorus target loads within a basin; and/or • The State may exchange nitrogen and phosphorus loads from one basin to another within the State. 33
The Chesapeake Bay Performance and Accountability System 35
Employ Federal Actions or Consequences Monitor Progress Set 2-Year Milestones Mandatory Pollution Diet at Work Develop Watershed Implementation Plans Establish Bay TMDL: 36
Watershed Implementation Plan Expectations • Identify allowable loads by major river basin, tidal segment watershed, county and pollutant source sector • Identify Program gaps and strategy • Commit to develop and implement 2-year milestones at the county scale • Develop contingencies 37
Federal Consequences Directed at states not achieving expectations Will be outlined in an EPA letter this fall. May include: Assigning more stringent pollution reductions to regulated point sources (e.g., wastewater, stormwater, CAFOs) Objecting to state-issued NPDES permits Limiting or prohibiting new or expanded discharges (e.g., wastewater, stormwater) of nutrients and sediment Withholding, conditioning or reallocating federal grant funds 38
Bay TMDL- Presidential Executive Order Connections • Create Federal Leadership Committee • Create the Performance and Accountability Framework • Expand regulatory tools for CAFO’s and urban and suburban runoff • Improve nutrient and sediment controls on federal lands and roads • Target farm conservation measures at high priority areas 39
Your Role in Bay TMDL Process Major basin jurisdiction loading targets Local Program Capacity/Gap Evaluation Final TMDL Established December 2010 Oct 2009 Bay TMDL Public Meetings Phase 2 Watershed Implementation Plans: Jan – Nov 2011 Divide Target Loads among Watersheds, Counties, Sources November-December 2009 Phase 1 Watershed Implementation Plans: November 2009 – August 2010 2-year milestones, reporting, modeling, monitoring Starting 2011 Public Review And Comment August-October 2010 40
Example: Projected Nitrogen Delivery from Major Basin in Each Jurisdiction by Source Sector Propose new legislative authorities Implement regulatory controls Examples of Some Planned Controls Propose increased budget to legislature Increased program budget Increased controls Rulemaking 35 26 Load Reduction Schedule 20 Interim Targets Final Targets Milestones for Assessing Progress Stage 1 Implementation Stage 2 Implementation • Also divide jurisdiction load by 303(d) segment drainage area and, by November 2011, local area • Attain jurisdiction-wide load reductions by the interim target, or justify why can still meet final target • Jurisdiction would determine desired 2-year schedule to meet interim and final target loads • EPA first evaluates milestones based on consistency with jurisdiction target load. EPA accepts shifts among source sectors, basins, segment drainages, and local areas if jurisdiction target load is met and local and Bay water quality goals are achieved
Bay TMDL: Bottom-line • Actions will clean and protect local waters in DC thereby supporting the local economy • Restore a thriving Chesapeake Bay • Federal, state, local officials and agencies will be fully accountable to the public • Consequences for inaction, lack of progress 42
Further Information • Chesapeake Bay TMDL web site www.epa.gov/chesapeakebaytmdl • U.S. EPA Region 3 Contacts • Water Protection Division • Bob Koroncai • 215-814-5730; koroncai.robert@epa.gov • Jennifer Sincock (sincock.jennifer@epa.gov) • Chesapeake Bay Program Office • Rich Batiuk • 410-267-5731; batiuk.richard@epa.gov • Katherine Antos (antos.katherine@epa.gov) 43
Thank you for your participation. That concludes today’s meeting. 45