Download
1 / 28
290 likes | 482 Views
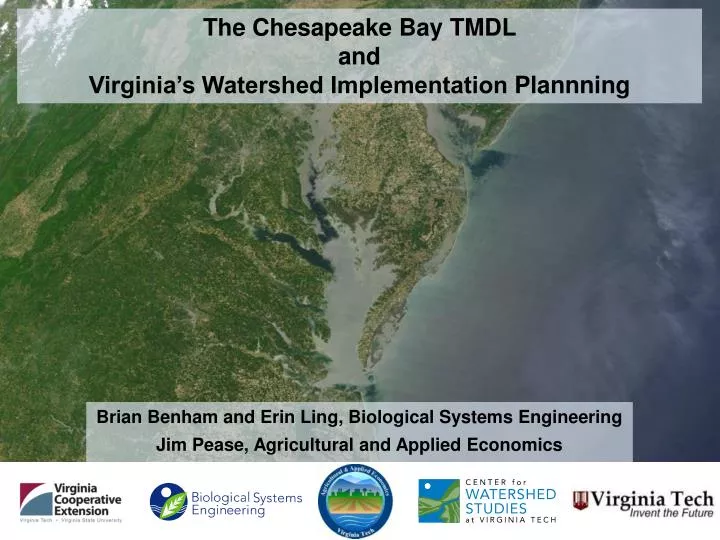
The Chesapeake Bay TMDL and Virginia’s Watershed Implementation Plannning. Brian Benham and Erin Ling, Biological Systems Engineering Jim Pease, Agricultural and Applied Economics. Overview . Chesapeake Bay and Bay Watershed statistics Efforts to clean up the Bay

E N D
The Chesapeake Bay TMDL and Virginia’s Watershed Implementation Plannning Brian Benham and Erin Ling, Biological Systems Engineering Jim Pease, Agricultural and Applied Economics
Overview • Chesapeake Bay and Bay Watershed statistics • Efforts to clean up the Bay • Total Maximum Daily Load (TMDL) definition and development • Water quality in the Bay • Pollutant sources and loads • Tools used to develop the Bay TMDL • Reducing pollutant loads to the Bay: Implementing the Bay TMDL
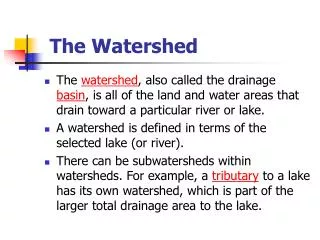
Chesapeake Bay Watershed • Largest U.S. estuary • 64,000 mi2 watershed; six states and District of Columbia • 10,000 miles of shoreline (longer than west coast) • 14:1 land to water surface ratio • Average depth 21 ft • Over 3,600 species of plants and animals • $750 million contributed annually to local economy from the Bay • Population = 17 million and growing Source: Chesapeake Bay Program
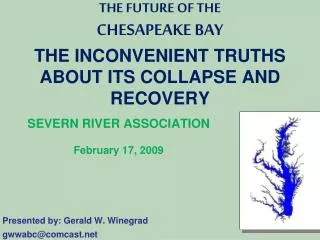
Chesapeake Bay TMDL: How we got here • Water quality deterioration and decreased productivity recognized in the 1970s • 1972 Clean Water Act requires TMDLs for impaired waters • 1983 and 1987 Chesapeake Bay Agreements • Acknowledged decline in living resources • Established Chesapeake Bay Program in EPA Region 3 • 1999 lawsuit – EPA commits to bring the Bay and tidal tributaries into compliance with water quality criteria by 2010 or develop TMDL • 2004 – 2006 Tributary Strategies • Outlined implementation activities to reduce N, P, and sediment by river basin • 2009 Executive Order • 2010 EPA issues Chesapeake Bay TMDL http://walthubis.blogspot.com/2005/12/chesapeake-bay-fishing.html
What is a TMDL? • A Total Maximum Daily Load (TMDL) quantifies the amount of a particular pollutant that a waterbody can receive and still meet water quality criteria – “pollution diet” • TMDL = WLA + LA + MOS Where: WLA = waste load allocation (sum of point source loads) LA = load allocation (sum of nonpoint source loads) MOS = margin of safety • Bay TMDL addresses nutrients (nitrogen and phosphorus) and sediment expressed as total suspended solids (TSS) Portion of the TMDL load that accounts for a lack of knowledge about relationship between pollutant loads and water quality. MOS in Bay TMDL is IMPLICITLY included in WLAs and LAs.
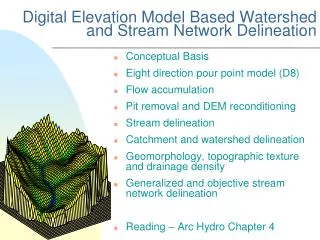
How is a TMDL developed? Clean TMDL Development Study Impairment Designation Water quality standards met Water quality standards not met React to lessons learned “Adaptive Management” Assess Progress Implementation Determine target pollutant loads needed to meet WQ criteria Implementation Planning How many and what type of pollutant control measures are needed to meet target loads? Illustration adapted from original developed by Dr. Robert Brent, James Madison University
Bay and tributaries are impaired • “Impaired” = does not meet water quality criteria • 92 impaired tidal segments, 39 are all or in part in VA • EPA is establishing “pollution diets” (TMDLs) for these segments • TMDLs developed for • Nitrogen • Phosphorus • Sediment http://www.chesapeakebay.net/content/maps/cbp_28727.pdf
So….WHAT’S happening? water quality criteria violated poor water quality, decreased habitat, Bay species out of balance Nitrogen Chlorophyll a (algal growth) Phosphorus Dissolved Oxygen Sediment Water Clarity/ Submerged Aquatic Vegetation
Water quality criteria for Bay and tidal tributaries: Chlorophyll a • Measure of algal growth • Excess nutrients produce algal blooms • block sunlight • reduce water clarity • decaying algae deplete dissolved oxygen http://www.deq.state.va.us/info/Potomacalgalbloom.html http://hamptonroads.com/2009/08/algae-blooms-spreading- chesapeake-bay
Water quality criteria for Bay and tidal tributaries: Water clarity/Submerged Aquatic Vegetation (SAV) • Water clarity (visibility of Secchi disc, depth) • Affected by nutrient and sediment loading • Impacts the extent and survival of SAV; important habitat for finfish and shell fish populations http://www.ncfisheries.net/habitat/chppSAV.html http://ian.umces.edu/imagelibrary/displayimage-92-846.html
Water quality criteria for Bay and tidal tributaries: Dissolved Oxygen (DO) • Amount of oxygen dissolved in water (mg/L) • Affected by nutrient loading, circulation, water temperature • DO criteria vary by season and species Ambient Water Quality Criteria for Dissolved Oxygen, Water Clarity and Chlorophyll a for the Chesapeake Bay and Its Tidal Tributaries. April 2003. USEPA.
Water quality criteria for Bay and tidal tributaries: Dissolved Oxygen (DO) • Amount of oxygen dissolved in water (mg/L) • Affected by nutrient loading, circulation, water temperature • DO criteria vary by season and species • Extremely low DO levels result in “dead zone” Ambient Water Quality Criteria for Dissolved Oxygen, Water Clarity and Chlorophyll a for the Chesapeake Bay and Its Tidal Tributaries. April 2003. USEPA.
What are the sources? water quality criteria violated poor water quality, decreased habitat, Bay species out of balance Nitrogen Chlorophyll a (algal growth) Phosphorus Dissolved Oxygen Sediment Water Clarity/ Submerged Aquatic Vegetation
Nitrogen loading to the Bay by source http://www.chesapeakebay.net/status_nitrogensources.aspx?menuitem=19797, last accessed 10/2010, simulated loads using CBWM Phase 4.3
Phosphorus loading to the Bay by source http://www.chesapeakebay.net/status_nitrogensources.aspx?menuitem=19797, last accessed 10/2010, simulated loads using CBWM Phase 4.3
Sediment loading to the Bay by source http://www.chesapeakebay.net/status_nitrogensources.aspx?menuitem=19797, last accessed 10/2010, simulated loads using CBWM Phase 4.3
Modeling the Chesapeake Bay • The Chesapeake Bay Program uses a suite of models to predict the water quality in the Bay. • The models use mathematical relationships to simulate how the Bay responds to changes in population, land use, and pollution management. Airshed Model Watershed Model Chesapeake Bay Estuary Models
Chesapeake Bay Watershed Model (CBWM) • County-based input data: • population • land use • cropping systems • livestock • best management practices (BMPs) • Topographic input data: • soils • slopes • hydrology • Meteorological input data • precipitation • temperature • solar radiation • etc. CBWM outputs (nitrogen, phosphorus, and sediment loads) are inputs to estuary model that is used to simulate water quality and living resources in the Bay. Graphics source: Chesapeake Bay Program
CBWM illustration • River reach in each subwatershed receives nutrient and sediment loads from the land uses in that subwatershed and from upstream reaches River/Stream Reach Model outputs flow, sediment, nitrogen, and phosphorus Land uses Graphics source: Chesapeake Bay Program
Urban High Density Pervious and Impervious Low Density Pervious and Impervious MS4 (permitted) Bare/Construction Forest Wooded Harvested Forest Extractive (active/abandoned) Open Water (non tidal) Agricultural Alfalfa hay Nursery Pasture (w/ and w/o nutrient mgmt) Degraded Riparian Pasture Hay (w/ and w/o fertilizer) Animal Feeding Operations (AFO) Various crops and crop rotations Conventional (high) till (w/ and w/o manure) Conservation (low) till (w/ and w/o manure) Land uses in the CBWM Plus: Point Sources and Septic
2009 model estimated base-line loads and 2025 final TMDL target loads http://www.epa.gov/reg3wapd/tmdl/ChesapeakeBay/tmdlexec.html http://www.pserie.psu.edu/seagrant/ais/watershed/chesapeake.htm
Virginia N model-estimated and target loads - 19% million lbs/year Bay Journal July-August 2010; Virginia Watershed Implementation Plan Phase 1: http://www.dcr.virginia.gov/soil_and_water/baytmdl.shtml http://www.epa.gov/reg3wapd/tmdl/ChesapeakeBay/tmdlexec.html
Virginia P model-estimated and target loads - 25% million lbs/year Bay Journal July-August 2010; Virginia Watershed Implementation Plan Phase 1: http://www.dcr.virginia.gov/soil_and_water/baytmdl.shtml http://www.epa.gov/reg3wapd/tmdl/ChesapeakeBay/tmdlexec.html
Watershed Implementation Plans (WIPs) • Roadmap of how states and DC, in partnership with local and federal governments, will implement pollution control measures to achieve and maintain TMDL targets • Two-year implementation milestones began 2013 • WIPs evaluated by EPA for “reasonable assurance” • Phase II WIP released March 2012 http://www.deq.virginia.gov/Portals/0/DEQ/Water/TMDL/Baywip/vatmdlwipphase1.pdf http://www.deq.virginia.gov/Portals/0/DEQ/Water/TMDL/Baywip/vatmdlwipphase2.pdf Additional detail about Virginia’s participation in the Bay TMDL can be found at: http://www.deq.virginia.gov/Programs/Water/ChesapeakeBay/ChesapeakeBayWatershedImplementationPlan.aspx
WIPs developed in phases • Phase I (2010) • Determine sector-specific loads for major river basins • Develop strategy to implement control measures that achieve TMDL target loads • Emphasis on 2017 interim goal of having control measures in place to achieve 60% of required pollution reduction • Phase II (2012) • Refine sector-specific loads at finer geographic scale • Engage local partners to develop strategy to implement control measures at finer geographic scale • Emphasis on 2017 interim goal • Phase II (2017) • Refinement of Phase 2 WIP to reflect “lessons learned” (adaptive mgmt) • Determine measures to be implemented between 2018 and 2025 to achieve TMDL target loads http://www.epa.gov/reg3wapd/pdf/pdf_chesbay/tmdl_implementation_letter_110409.pdf
Bay TMDL Timeline… • Dec 2010: Final Bay TMDL released • Dec 2012: Draft Phase II WIPs due to EPA • Dec 2011: States must implement reduction milestones set in May 2009 • June 2017: States submit draft Phase III WIPs to EPA to ensure that all necessary practices will be in place by 2025 • Nov 2017: States submit final Phase III WIPs to EPA • Dec 2017: Sufficient practices in place to achieve 60% of load reductions • Dec 2025: All restoration practices in place to achieve 100% of load reductions • States required to report BMP implementation milestones every two years. 2017 2015 2023 2021 2019 2013 2011 2010 2025
Additional Resources • Webinar of previous version of this presentation can be accessed at http://connect.extension.iastate.edu/p43305770/Note: the presentation in the webinar is based on an earlier draft of the Virginia WIP. • EPA Region 3 Chesapeake Bay TMDL: http://www.epa.gov/chesapeakebaytmdl/ • Virginia Department of Conservation and Recreation: http://www.dcr.virginia.gov/soil_and_water/baytmdl.shtml • Virginia Department of Environmental Quality: http://www.deq.state.va.us/tmdl/chesapeakebay.html
Thank you http://flavormagazinevirginia.com/got-dairy-farmers/ http://www.annmeekins.com/pages.asp?pg=northernneck_tour http://www.virginiaplaces.org/waste/stormwater.html Brian Benham (benham@vt.edu) and Erin Ling (ejling@vt.edu) Biological Systems Engineering Jim Pease (jim.pease@vt.edu) Agricultural and Applied Economics