Download
1 / 31
330 likes | 602 Views
Business Statistics: A Decision-Making Approach 6 th Edition. Chapter 7 Estimating Population Values. Confidence Intervals. Content of this chapter Confidence Intervals for the Population Mean, μ when Population Standard Deviation σ is Known

E N D
Business Statistics: A Decision-Making Approach 6th Edition Chapter 7Estimating Population Values Fall 2006 – Fundamentals of Business Statistics
Confidence Intervals Content of this chapter • Confidence Intervals for the Population Mean, μ • when Population Standard Deviation σ is Known • when Population Standard Deviation σ is Unknown • Determining the Required Sample Size Fall 2006 – Fundamentals of Business Statistics
Confidence Interval Estimation for μ • Suppose you are interested in estimating the average amount of money a Kent State Student (population) carries. How would you find out? Fall 2006 – Fundamentals of Business Statistics
Point and Interval Estimates • A point estimate is a single number, • a confidence interval provides additional information about variability Upper Confidence Limit Lower Confidence Limit Point Estimate Width of confidence interval Fall 2006 – Fundamentals of Business Statistics
Estimation Methods • Point Estimation • Provides single value • Based on observations from 1 sample • Gives no information on how close value is to the population parameter • Interval Estimation • Provides range of values • Based on observations from 1 sample • Gives information about closeness to unknown population parameter • Stated in terms of “level of confidence.” • To determine exactly requires what information? Fall 2006 – Fundamentals of Business Statistics
I am 95% confident that μ is between 40 & 60. Estimation Process Random Sample Population Mean x = 50 (mean, μ, is unknown) Sample Fall 2006 – Fundamentals of Business Statistics
General Formula • The general formula for all confidence intervals is: Point Estimate (Critical Value)(Standard Error) Fall 2006 – Fundamentals of Business Statistics
Confidence Intervals Confidence Intervals Population Mean σKnown σUnknown Fall 2006 – Fundamentals of Business Statistics
(1-a)x100% Confidence Interval for m Half Width H Half Width H m Lower Limit Upper Limit
CI Derivation Continued • Parameter = Statistic ± Error (Half Width) Fall 2006 – Fundamentals of Business Statistics
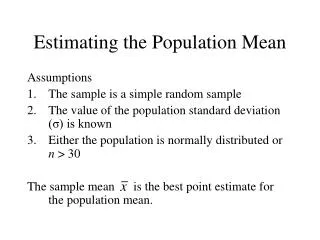
Confidence Interval for μ(σ Known) • Assumptions • Population standard deviation σis known • Population is normally distributed • If population is not normal, use large sample • Confidence interval estimate Fall 2006 – Fundamentals of Business Statistics
(1-a)x100% CI m 0 Z Z(a/2) Z(1-a/2)
Interpretation Sampling Distribution of the Mean x x1 100(1-)%of intervals constructed contain μ; 100% do not. x2 Confidence Intervals Fall 2006 – Fundamentals of Business Statistics
Factors Affecting Half Width • Data variation, σ : H as σ • Sample size, n : H as n • Level of confidence, 1 - : H if 1 - Fall 2006 – Fundamentals of Business Statistics
Example • A sample of 11 circuits from a large normal population has a mean resistance of 2.20 ohms. We know from past testing that the population standard deviation is .35 ohms. • Determine a 95% confidence interval for the true mean resistance of the population. Fall 2006 – Fundamentals of Business Statistics
Confidence Intervals Confidence Intervals Population Mean Population Proportion σKnown σUnknown Fall 2006 – Fundamentals of Business Statistics
Confidence Interval for μ(σ Unknown) • If the population standard deviation σ is unknown, we can substitute the sample standard deviation, s • This introduces extra uncertainty, since s is variable from sample to sample • So we use the t distribution instead of the standard normal distribution Fall 2006 – Fundamentals of Business Statistics
Confidence Interval for μ(σ Unknown) • Assumptions • Population standard deviation is unknown • Population is normally distributed • If population is not normal, use large sample • Use Student’s t Distribution • Confidence Interval Estimate (continued) Fall 2006 – Fundamentals of Business Statistics
Student’s t Distribution • The t is a family of distributions • The t value depends on degrees of freedom (d.f.) • Number of observations that are free to vary after sample mean has been calculated d.f. = n - 1 Fall 2006 – Fundamentals of Business Statistics
Student’s t Distribution Note: t z as n increases Standard Normal (t with df = ) t (df = 13) t-distributions are bell-shaped and symmetric, but have ‘fatter’ tails than the normal t (df = 5) t 0 Fall 2006 – Fundamentals of Business Statistics
Student’s t Table Upper Tail Area Let: n = 3 df = n - 1 = 2= .10/2 =.05 df .25 .10 .05 1 1.000 3.078 6.314 0.817 1.886 2 2.920 /2 = .05 3 0.765 1.638 2.353 The body of the table contains t values, not probabilities 0 t 2.920 Fall 2006 – Fundamentals of Business Statistics
t distribution values With comparison to the z value Confidence t t t z Level (10 d.f.)(20 d.f.)(30 d.f.) ____ .80 1.372 1.325 1.310 1.28 .90 1.812 1.725 1.697 1.64 .95 2.228 2.086 2.042 1.96 .99 3.169 2.845 2.750 2.58 Note: t z as n increases Fall 2006 – Fundamentals of Business Statistics
Example A random sample of n = 25 has x = 50 and s = 8. Form a 95% confidence interval for μ Fall 2006 – Fundamentals of Business Statistics
Approximation for Large Samples • Since t approaches z as the sample size increases, an approximation is sometimes used when n 30: Correct formula Approximation for large n Fall 2006 – Fundamentals of Business Statistics
Determining Sample Size • The required sample size can be found to reach a desired half width (H) and level of confidence (1 -) • Required sample size, σ known: Fall 2006 – Fundamentals of Business Statistics
Determining Sample Size • The required sample size can be found to reach a desired half width (H) and level of confidence (1 -) • Required sample size, σ unknown: Fall 2006 – Fundamentals of Business Statistics
Required Sample Size Example If = 45, what sample size is needed to be 90% confident of being correct within ± 5? Fall 2006 – Fundamentals of Business Statistics
Confidence Interval Estimates No Is X ~ N? Yes Sample Size? Small Large Is s known? Yes No 1. Use Z~N(0,1) 2. Use T~t(n-1) Fall 2006 – Fundamentals of Business Statistics
Confidence Intervals (1-a)% • Standard Normal • T distribution Fall 2006 – Fundamentals of Business Statistics
YDI 10.17 A beverage dispensing machine is calibrated so that the amount of beverage dispensed is approximately normally distributed with a population standard deviation of 0.15 deciliters (dL). • Compute a 95% confidence interval for the mean amount of beverage dispensed by this machine based on a random sample of 36 drinks dispensing an average of 2.25 dL. • Would a 90% confidence interval be wider or narrower than the interval above. • How large of a sample would you need if you want the width of the 95% confidence interval to be 0.04? Fall 2006 – Fundamentals of Business Statistics
YDI 10.18 A restaurant owner believed that customer spending was below the usual spending level. The owner takes a simple random sample of 26 receipts from the previous weeks receipts. The amount spent per customer served (in dollars) was recorded and some summary measures are provided: n = 26, X = 10. 44, s2 = 7. 968 • Assuming that customer spending is approximately normally distributed, compute a 90% confidence interval for the mean amount of money spent per customer served. • Interpret what the 90% confidence interval means. Fall 2006 – Fundamentals of Business Statistics