Download
1 / 21
300 likes | 1.06k Views
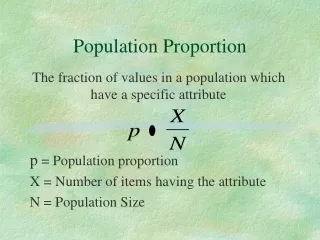
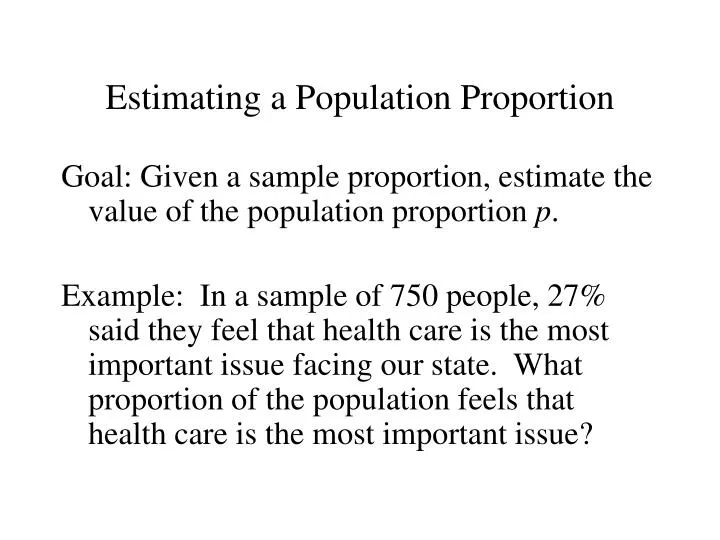
Estimating a Population Proportion. Goal: Given a sample proportion, estimate the value of the population proportion p .

E N D
Estimating a Population Proportion Goal: Given a sample proportion, estimate the value of the population proportion p. Example: In a sample of 750 people, 27% said they feel that health care is the most important issue facing our state. What proportion of the population feels that health care is the most important issue?
Assumptions • The sample is a simple random sample. • The conditions for the binomial distribution apply: There are a fixed number of trials, the trials are independent, there are two categories of outcomes, and the probabilities remain constant for each trial. • The normal distribution can be used to approximate the distribution of sample proportions, since and Since p and q are not known, we use the sample proportion to estimate their values.
New Notation p = population proportion sample proportion (of x successes in a sample of size n)
The sample proportion is the best point estimate (single value approximation) of the population proportion p. Problem: Using to approximate p doesn’t convey how accurate we expect our estimate to be. To do that, we need confidence intervals
Confidence Intervals (CI) A confidence interval is a range (or interval) of values used to estimate the true value of the population parameter. A confidence level is the probability that our confidence interval contains the true value of p. The confidence level is expressed as a probability 1- α
Common Values 90% confidence level (α = 0.10) 95% confidence level (α = 0.05) 99% confidence level (α = 0.01)
An example of a Confidence Interval Based on our survey earlier, The 95% confidence interval estimate of the population proportion p is: 0.235 < p < 0.305 This means that there is 95% chance that this interval contains the actual population proportion p. In other words, 95% of the time that we do a sample, the confidence interval will contain the true population proportion.
Critical Values A critical value is a z-score that separates outcomes that are likely to occur from those that are unlikely to occur. An example: For 95% confidence interval:
For the 95% confidence interval, α = .05 Notice that 0.025 falls above the critical value, and 0.025 falls below the opposite (negative) critical value. Each of these areas is α/2. Notation The critical value zα/2 is the positive z-value that separates the top area of α/2. -zα/2 is the boundary of the bottom area of α/2.
Another Example So if our confidence level was 99%, the critical value zα/2 would be the score that separates the top 0.5% of data, and –zα/2 would separate the bottom 0.5% of data. Leaving 99% of the data between –zα/2 and zα/2
Finding Critical Values Example: For the 95% confidence interval, the area above zα/2 is .025, so the area below is 1-.025 = .975 So P(z < zα/2) = .975. From the table, we find zα/2 =1.96
Common Critical Values 90% α = .10 Critical value 1.645 95% α = .05 Critical value 1.96 99% α = .01 Critical value 2.575 (listed at bottom of z-score table)
Margin of Error The margin of error E is the maximum likely (with probability 1-α) difference between the observed proportion and the population proportion p.
Summary of Procedure for finding a Confidence Interval • Verify the required assumptions are satisfied • Find the critical value that corresponds to the desired confidence level • Evaluate the margin of error E • Find the values and . Write the confidence interval • Round values to three decimal places
Example In a sample of 750 people, 27% said they feel that health care is the most important issue facing our state. 95% confidence level, so
Example continued so our confidence interval is 0.238 < p < 0.302
Example continued 0.238 < p < 0.302 Based on our survey results, we are 95% confident that the true percentage of Washingtonians who feel that health care is the most important issue facing the state is between 23.8% and 30.2%.
From a Confidence Interval If you know a confidence interval, the middle value is the point estimate (in this case, ). You can find it by calculating If you know a confidence interval, the Margin of Error is half the width of the confidence interval. You can find it by calculating
Determining Sample Size from desired Margin of Error when is known when is not known
Homework 6.2: 5, 13, 17, 21, 27, (29)