Download
1 / 2
20 likes | 99 Views
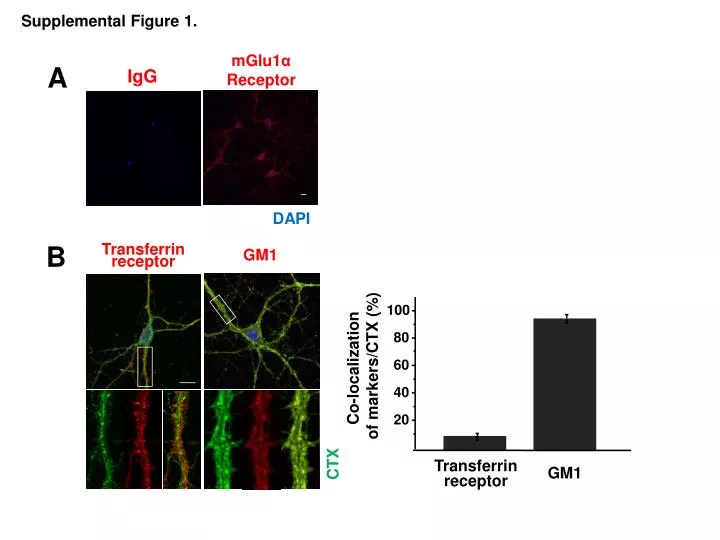
Supplemental Figure 1 . mGlu1 α Receptor. A. IgG. 100. 80. DAPI. Co-localization of markers/CTX (%). 60. B. GM1. Transferrin receptor. 40. 20. Transferrin receptor. GM1. CTX. Supplemental Figure 2. A. Tat-blocking. Tat-mutant. Control. IP : mGlu1 α. Caveolin. mGlu1 α.

E N D
Supplemental Figure 1. mGlu1α Receptor A IgG 100 80 DAPI Co-localization of markers/CTX (%) 60 B GM1 Transferrin receptor 40 20 Transferrin receptor GM1 CTX
Supplemental Figure 2. A Tat-blocking Tat-mutant Control IP : mGlu1α Caveolin mGlu1α B DHPG 0.90 0.80 Control Tat-blocking peptide Tat-mutant peptide Fura-2 340/380 ratio 0.70 0.60 0.50 0 100 200 300 400 500 (Sec)