Download
1 / 2
20 likes | 68 Views
Supplemental figure 1. A. B. LFN. naked DNA. C. D. 【 Ad genome 】. 【 pDNA 】. Amount of DNA. Amount of DNA. ( ×10 9 copies). ( ×10 10 copies). 1.1. 2.1. 4.3. 0.85. 1.7. 3.4. 6.8. E. F. 【 Ad genome 】. 【 pDNA 】. 25. 60. y = 8.0×10 -10 x + 0.030 R 2 = 0.989.

E N D
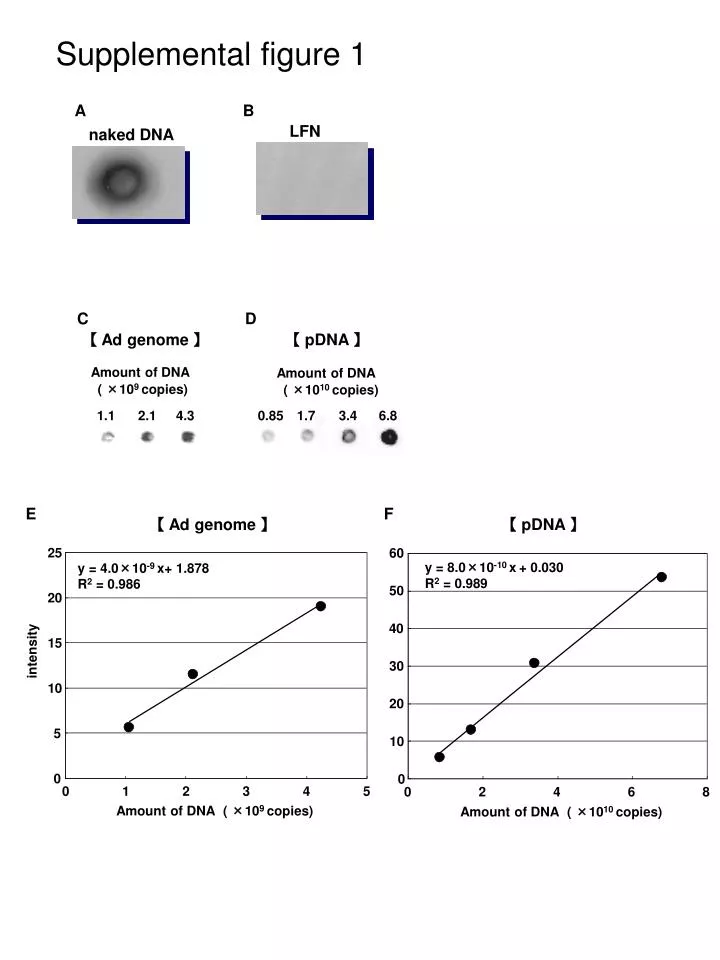
Supplemental figure 1 A B LFN naked DNA C D 【 Ad genome 】 【 pDNA 】 Amount of DNA Amount of DNA ( ×109 copies) ( ×1010 copies) 1.1 2.1 4.3 0.85 1.7 3.4 6.8 E F 【 Ad genome 】 【 pDNA 】 25 60 y = 8.0×10⁻¹⁰ x+ 0.030 R2 = 0.989 y = 4.0×10⁻⁹ x+ 1.878 R2 = 0.986 50 20 40 15 intensity 30 10 20 5 10 0 0 0 1 2 3 4 5 0 2 4 6 8 Amount of DNA ( ×109 copies) Amount of DNA ( ×1010 copies)
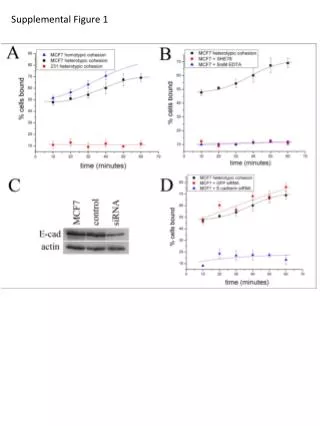
Legend for supplemental figure 1 (A,B) Specific detection of naked DNA blotted on the membrane by means of hybridization. Naked DNA or lipoplex was spotted on the membrane, and then hybridized with alkaline phosphatase-labeled probe. As a results, clear signal was detected in naked DNA(A). In contrast, no signal was detected in LFN (B), indicating that hybridization process was blocked by condensation via steric hindrance. This data correctively indicated that detection of pDNA based on the hybridization technique can visualize only decondensed form of DNA. (C-F) Comparison of hybridization efficiency of probes between the adenovirus genome DNA and pDNA by a dot blot analysis. The adenovirus genome DNA (C) or pDNA (D) was blotted on a nylon membrane the at the indicated dose. After the hybridization of probes, the signals were amplified by TSA system, and then detected by an Image reader. The intensity of signals in the dot blot analysis was quantified by a Scion Image. E and F represent the result of adenovirus geneome DNA and pDNA. The vertical values represent the mean values of two experiments.