Download
1 / 12
120 likes | 125 Views
This study examines the effects of panobinostat on gene expression in AML cells. The results show changes in the expression of various genes and potential pathways affected by the drug.

E N D
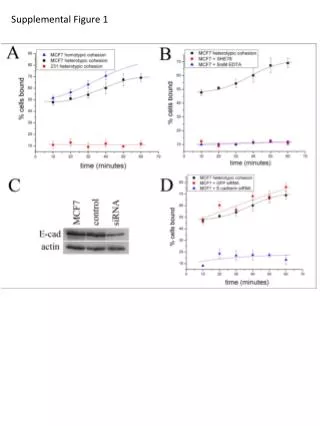
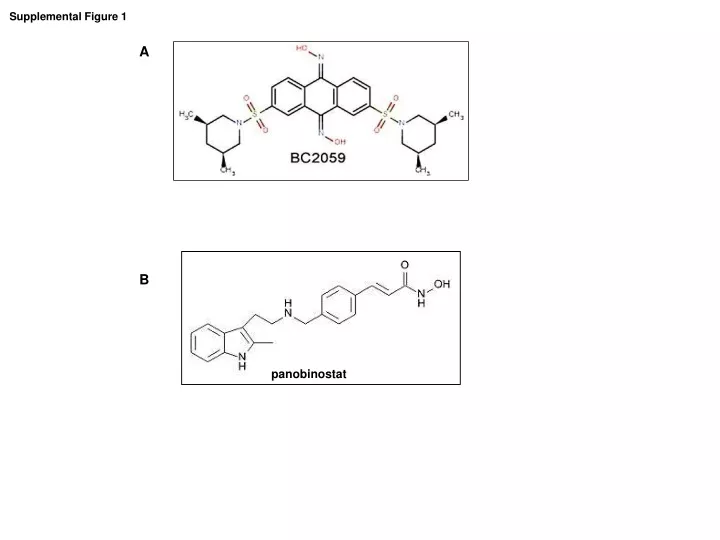
Supplemental Figure 1 A B panobinostat
Supplemental Figure 2 Control 20 50 nM BC2059, 24 hr A OCI-AML3 B
Supplemental Figure 2 Control 20 50 100 nM BC2059, 48 hr C OCI-AML3 TO-PRO-3 iodide Annexin V-FITC D Control 50 100 nM BC2059, 48 hr TO-PRO-3 iodide HL-60 Annexin V-FITC E Control 20 50 100 nM BC2059, 48 hr Primary FLT3-ITD AML Propidium iodide
Supplemental Figure 3 OCI-AML3 MV4-11 C B A 0 20 50 100 nM, BC2059, 24 h 0 20 50 100 nM, BC2059, 24 h BIMEL BIMEL BIML BIML BIMS BIMS p27 p27 MCL1 β-Actin β-Actin D Primary FLT3-ITD AML 0 20 50 100 nM, BC2059, 24 h β-Catenin BIMEL BIML BIMS p27 β-Actin
MV4-11 cells Supplemental Figure 4 Merge TBL1/β-Catenin A TBL1 DAPI β-Catenin Primary AML cells B CD34+ Primary FLT3-ITD AML cells TBL1 β Catenin Merge DAPI β-catenin DAPI Merge Control Control Control 20 nM BC2059 50 nM BC2059 20 nM BC2059 100 nM BC2059 D CD34+ FLT3 WT Primary AML cells 100 nM BC2059 C Merge DAPI β-catenin Control 100 nM BC2059, 16 hours
Supplemental Figure 5 A B D C
Supplemental Table 1: Genes with greater than 3 fold induction in OCI-AML3 cells following treatment with 100 nM of BC-2059 for 8 hours.
Supplemental Table 2: Genes with greater than 2 fold depletion in OCI-AML3 cells following treatment with 100 nM of BC-2059 for 8 hours
Supplemental Table 3: Ingenuity Pathway Analysis of the 4 most perturbed networks in OCI-AML3 cells following treatment with 100 nM of BC-2059 for 8 hours.
Supplemental Figure 6 C OCI-AML3 BC2059 PS Fa CI (nM) (nM) 60 6 0.566 1.043 70 7 0.701 0.961 75 7.5 0.811 0.812 80 8 0.836 0.811 90 9 0.9 0.735 A HL-60 BC2059 PS Fa CI (nM) (nM) 60 6 0.52 1.027 70 7 0.66 0.792 75 7.5 0.771 0.578 80 8 0.756 0.653 90 9 0.867 0.442 MV4-11 BC2059 PS Fa CI (nM) (nM) 30 3 0.474 0.963 35 3.5 0.641 0.612 40 4 0.746 0.452 50 5 0.942 0.128 B * *
Supplemental Figure 7 OCI-AML3 cells A TBL1 DAPI Merge Control 10 nM PS, 16 h 20 nM PS, 16 h 50 nM PS, 16h B OCI-AML3 0 10 20 50 nM, PS, 16 h TBL1 β-Actin
Supplemental Figure 8 AML #1 AML #2