Download

1 / 37
400 likes | 680 Views
REVIEW Hypothesis Tests of Means. 5 Steps for Hypothesis Testing Test Value Method. Develop null and alternative hypotheses Specify the level of significance, Use the level of significance to determine the critical values for the test statistic and state the rejection rule for H 0

E N D
REVIEW Hypothesis Tests of Means
5 Steps for Hypothesis TestingTest Value Method • Develop null and alternative hypotheses • Specify the level of significance, • Use the level of significance to determine the critical values for the test statistic and state the rejection rule for H0 • Collect sample data and compute the value of test statistic • Use the value of test statistic and the rejection rule to determine whether to reject H0
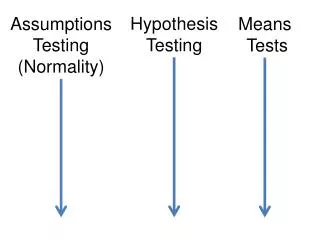
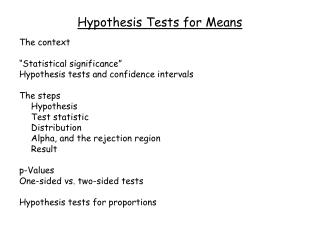
When to use z and When to use t • USEz • Large n or sampling from a normal distribution • σ is known • USEt • Large n or sampling from a normal distribution • σ is unknown z and t distributions are used in hypothesis testing. _ These are determined by the distribution of X.
General Form ofTest Statistics for Hypothesis Tests Depending on whether or not σ is known • A test statistic is nothing more than a measurement of how far away the observed value from your sample is from some hypothesized value, v. • It is measured in terms of standard errors • σ known = z-statistic with standard error = • σ unknown = t-statistic with standard error = • The general form of a test statistic is:
Example The average cost of all required texts for introductory college English courses seems to have gone up substantially as the professors are assigning several texts. • A sample of 41 courses was taken • The average cost of texts for these 41 courses is $86.15 Can we conclude the average cost: • Exceeds $80? • Is less than $90? • Differs from last year’s average of $95? • Differs from two year’s ago average of $78?
CASE 1: z-tests for σ Known Assume the standard deviation is $22. • Because the sample size > 30, it is not necessary to assume that the costs follow a normal distribution to determine the z-statistic. • In this case because it is assumed that σ is known (to be $22), these will be z-tests.
Example 1: Can we conclude µ > 80? 1 H0: µ = 80 HA: µ > 80 Select α = .05 TEST: Reject H0 (Accept HA) if z > z.05 = 1.645 z calculation: Conclusion: 1.790 > 1.645 There is enough evidence to conclude µ > 80. 2 3 4 5
Example 2: Can we conclude µ < 90? 1 H0: µ = 90 HA: µ < 90 Select α = .05 TEST: Reject H0 (Accept HA) if z <-z.05= -1.645 z calculation: Conclusion: -1.121 > -1.645 There is not enough evidence to conclude µ < 90. 2 3 4 5
Example 3: Can we conclude µ ≠ 95? 1 H0: µ = 95 HA: µ ≠ 95 Select α = .05 TEST: Reject H0 (Accept HA) if z <-z.025= -1.96 or if z > z.025 = 1.96 z calculation: Conclusion: -2.578 < -1.96 There is enough evidence to conclude µ ≠ 95. 2 3 4 5
Example 4: Can we conclude µ ≠ 78? 1 H0: µ = 78 HA: µ ≠ 78 Select α = .05 TEST: Reject H0 (Accept HA) if z <-z.025= -1.96 or if z > z.025 = 1.96 z calculation: Conclusion: 2.372 > 1.96 There is enough evidence to conclude µ ≠ 78. 2 3 4 5
P-values • P-values are a very important concept in hypothesis testing. • A p-value is a measure of how sure you are that the alternate hypothesis HA, is true. • The lower the p-value, the more sure you are that the alternate hypothesis, the thing you are trying to show, is true. So • A p-value is compared to α. • If the p-value < α; accept HA – you proved your conjecture • If the p-value > α; do not accept HA – you failed to prove your conjecture Low p-values Are Good!
5 Steps for Hypothesis TestingP-value Method • Develop null and alternative hypotheses • Specify the level of significance, • Collect sample data and compute the value of test statistic • Calculate p-value: Determine the probability for the test statistic • Compare p-value and : Reject H0 (Accept HA), if p-value <
Calculating p-values • A p-value is the probability that, if H0 were really true, you would have gotten a value • as least as great as the sample value for “>” tests • at most as great as the sample value for “<” tests • at least as far away from the sample value for “≠” tests • First calculate the z-value for the test. • The p-value is calculated as follows:
P-Value for “<” Test P-Value for “>” Test P-Value for “≠” Test, With z>0 P-Value for “≠” Test, With z<0 P-value P-value 0 Z 0 Z z z z z P-value = 2*area P-value = 2*area v v v v 0 Z 0 Z
Examples – p-Values • Example 1: Can we conclude µ > 80? • z = 1.79 • P-value = 1 - .9633 = .0367 (< α = .05). Can conclude µ > 80. • Example 2: Can we conclude µ < 90? • z = -1.12 • P-value = .1314 (> α = .05). Cannot conclude µ < 90. • Example 3: Can we conclude µ ≠ 95? • z = -2.58 • P-value = 2(.0049) = .0098 (< α = .05). Can conclude µ ≠ 95. • Example 4: Can we conclude µ ≠ 78? • z = 2.37 • P-value = 2(1-.9911) = .0178 (< α = .05). Can conclude µ ≠ 78.
=(D4-D7)/(D1/SQRT(D2)) =1-NORMSDIST(D8)
=(D4-D12)/(D1/SQRT(D2)) =NORMSDIST(D13)
=(D4-D17)/(D1/SQRT(D2)) =2*NORMSDIST(D18)
=(D4-D22)/(D1/SQRT(D2)) =2*(1-NORMSDIST(D23))
CASE 2: t-tests for σ Unknown • Because the sample size > 30, it is not necessary to assume that the costs follow a normal distribution to determine the t-statistic. • In this case because it is assumed that σ is unknown, these will be t-tests with 41-1 = 40 degrees of freedom. Assume s = 24.77.
Example 1: Can we conclude µ > 80? 1 H0: µ = 80 HA: µ > 80 Select α = .05 TEST: Reject H0 (Accept HA) if t >t.05,40 = 1.684 t calculation: Conclusion: 1.590 < 1.684 Cannot conclude µ > 80. 2 3 4 5
Example 2: Can we conclude µ < 90? 1 H0: µ = 90 HA: µ < 90 Select α = .05 TEST: Reject H0(Accept HA) if t<-t.05,40= -1.684 t calculation: Conclusion: -0.995 > -1.684 Cannot conclude µ < 90. 2 3 4 5
Example 3: Can we conclude µ ≠ 95? 1 H0: µ = 95 HA: µ ≠ 95 Select α = .05 TEST: Reject H0 (Accept HA) if t <-t.025,40= -2.021 or if t > t.025,40 = 2.021 t calculation: Conclusion: -2.288 < -2.021 Can conclude µ ≠ 95. 2 3 4 5
Example 4: Can we conclude µ ≠ 78? 1 H0: µ = 78 HA: µ ≠ 78 Select α = .05 TEST: Reject H0 (Accept HA) if t <-t.025,40= -2.021 or if t > t.025,40 = 2.021 t calculation: Conclusion: 2.107 > 2.012 Can conclude µ ≠ 78. 2 3 4 5
The TDIST Function in Excel • TDIST(t,degrees of freedom,1) gives the area to the right of a positive value of t. • 1-TDIST(t,degrees of freedom,1) gives the area to the left of a positive value of t. • Excel does not work for negative vales of t. • But the t-distribution is symmetric. Thus, • The area to the left of a negative value of t = area to the right of the corresponding positive value of t. • TDIST(-t,degrees of freedom,1) gives the area to the left of a negative value of t. • 1-TDIST(-t,degrees of freedom,1) gives the area to the right of a negative value of t. • TDIST(t,degrees of freedom,2) gives twice the area to the right of a positive value of t. • TDIST(-t,degrees of freedom,2) gives twice the area to the right of a negative value of t.
p-Values for t-Tests Using Excel P-values for t-tests are calculated as follows:
=(D3-G2)/D4 =TDIST(G3,40,1)
=(D3-G7)/D4 =TDIST(-G8,40,1)
=(D3-G12)/D4 =TDIST(-G13,40,2)
=(D3-G17)/D4 =TDIST(G18,40,2)
Test Value vs P-Value • Example of one-tailed, positive test value
Review • When to use z and when to use t in hypothesis testing • σ known – z • σ unknown – t • z and t statistics measure how many standard errors the observed value is from the hypothesized value • Form of the z or t statistic • Meaning of a p-value • z-tests and t-tests • By hand • Excel