Download
1 / 15
150 likes | 367 Views
Hypothesis Tests. Structure of hypothesis tests 1. choose the appropriate test based on: data characteristics, study objectives parametric or nonparametric two-sided, one-sided t-test, rank-sum test, others… 2. establish the null and alternate hypothesis

E N D
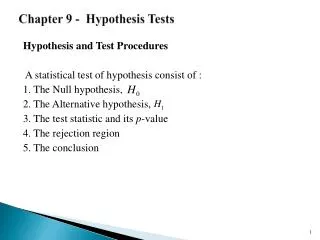
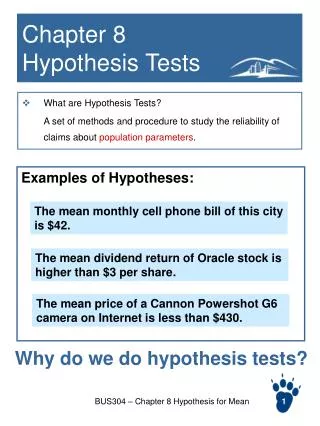
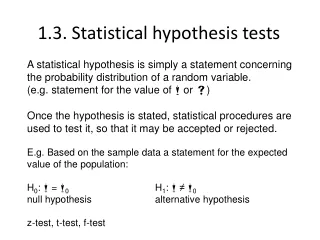
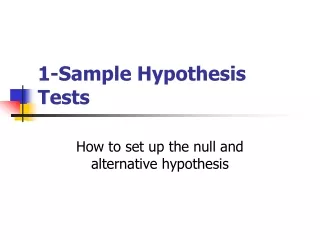
Hypothesis Tests • Structure of hypothesis tests 1. choose the appropriate test • based on: data characteristics, study objectives • parametric or nonparametric • two-sided, one-sided • t-test, rank-sum test, others… 2. establish the null and alternate hypothesis • null hypothesis, H0, is what is assumed true until the data indicate that it is likely to be false • alternative hypothesis, Ha, that we will accept if we decide to reject the null hypothesis 3. decide on an acceptable error rate a • a is probability of making a Type I error 4. compute the test statistic from the data 5. compute the p-value • p is the believability of the data, 6. reject the null hypothesis of p <= a
example: • soil samples = 115, 125, 110, 95, 105 pcf • 100 pcf specified • within specifications? • H0 : Ha : • Type I error: • choose a = 0.05 (95% confidence) • Type II error: • b = ?
Type of test on mean: • test statistic: z or t • one-tail? Upper or lower? • Upper: reject if z > za (or t) • Lower: reject if z < -za (or t) • two-tail? • Reject if z < - za/2 or z > za/2 (or t) • i.e., if |t| > ta/2
two-sided t-test on mean • H0: m = m0 (m - mo) = 0Ha: m # m0 • if t >= tcritical, (p <= a) then reject Howith 100(1-a)% confidence • if t < tcritical, then do not reject Ho. No basis to believe that the mean is different (not significantly different).
Calculations • mean = 110, s = 11.2 • Test statistic: tt = |110-100|/(11.2/2.24) = 2.000 • t(0.05, 4) = 2.776 • t < tcrit, do not reject H0, not out of spec • p = 0.116 • p > a, do not reject H0, not out of spec • if we chose a = 0.116, then t = tcrit
Notes on hypothesis test • Hypothesis test about a population variance • two-tailed or one-tailed • one-tail: prior information or direction • choosing a • choose lower when have more data • cannot change after the fact • report p • p • higher p means more significance to the data • observed significance level • not either / or • forget a and let the reader judge? • Power of test • b, prob of type II error, depends on true value of parameter (unknown) • Power of test = 1 – b • Power is probability of rejecting null hypothesis H0, when alternative hypothesis is true (making correct decision to reject H0) • Report all results, not just significant results • careful with outliers
Two-sample hypothesis tests • (one sample: e.g., does m = some number?) • (m1 - m2) : difference in means • md : mean difference; paired comparison of means • (p1 - p2) : difference in proportions • s21/ s22 : ratio of variances
Two-sample z test (large-sample) p.482 • independent random samples
Two-sample z test example • example 9.4 • H0: no difference in means • Ha: m1 - m2 < 0 (one-tail) • a = 0.05 zcrit = -1.645 • 1: mean = 78.67, variance = 59.08, n = 1002: mean = 102.87, variance = 69.33, n = 55 • z = -2.19 < zcrit REJECT H0 (mean 1 < mean 2) • p = P(z < -2.19) = 0.0143
Two-sample t test (small-sample) p.485 • assuming equal variances
Matched pairs t test p.496 • use paired data to test for difference in mean • actually, test if mean difference is zero
Comparing population variances • use ratio of variances • F = larger/smaller (for convenience) • F distribution • note on distributions • variance fits a chi-square distribution:c2 distribution is non-negative distribution that includes degrees of freedom • c2 distribution is a type of gamma distribution • F distribution is the distribution of the ratio of two independent chi-square random variables.
Two-sample t test (small-sample) • assuming unequal variances
Contingency Tables • Does one variable depend on the other? • Is the cell count equal to that expected??? • Problem 9.58 • H0 : hotspot type and rare species type are independentHa : they’re dependent • expected butterfly-but = 68*42/105 c2test < c2a=0.10 Do not reject H0: independent