Download
1 / 17
170 likes | 254 Views
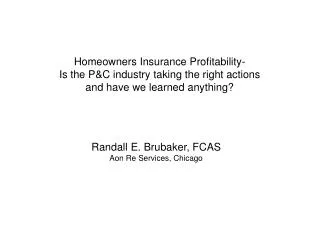
HOMEOWNERS PROFITABILITY. Jeffrey L. Kucera, FCAS 2003 CAS Annual Meeting New Orleans, Louisiana. WHY DON’T COMPANIES LIKE HOMEOWNERS?. Results fluctuate too much. Has been unprofitable in recent years. Catastrophe exposure. Requires a substantial capital investment. Coverage too broad.

E N D
HOMEOWNERS PROFITABILITY Jeffrey L. Kucera, FCAS 2003 CAS Annual Meeting New Orleans, Louisiana
WHY DON’T COMPANIES LIKE HOMEOWNERS? • Results fluctuate too much. • Has been unprofitable in recent years. • Catastrophe exposure. • Requires a substantial capital investment. • Coverage too broad.
CONNING’S INDUSTRY INSIGHT • Second largest line for Property-Casualty Insurers – 2002 Net Premiums of $40.3 Billion. • State Farm, Allstate and Farmers account for 45.1% of the industry total.
CONNING’S INDUSTRY INSIGHT • Unprofitable 19 of the past 21 years ending in 2002. • 10 times between 1991 and 2002 the combined ratio has exceeded 110%. • Minimal investment income. • ROE has remained negative since 1992.
WHY ARE THINGS LOOKING BETTER? • Aggressive Rate Changes • Tightened Underwriting • Coverage Restrictions
COMPANY RESULTS • State Farm • 2001 Loss Ratio—87.9% • 2002 Loss Ratio—73.1% • Allstate • 2001 Loss Ratio—70.2% • 2002 Loss Ratio—61.2
ONE COMPANY EXAMPLE - ALLSTATE • Nine Month Ending Results • 2002—80.6%; 2003—61.7% • April, 2003 Statement by CEO Edward Liddy • Planning to increase marketing and advertising in support of homeowners. • PIF is up in 32 states (2nd quarter vs. 1st quarter.
CONNING PROJECTIONS 2003 101.9% 2004 102.8% 2005 102.5%
THINGS TO BE CONCERNED ABOUT • How will regulators react to improved profitability of companies? • Credit issue is still an open concern in many states. • Use of some types of prior losses is being challenged in various markets. • Residual markets are growing.
What is the major outstanding question for homeowner insurers? Have companies truly addressed the underlying issues which led to their problems?
WHAT SHOULD THE INDUSTRY BE DOING? • Increased rates and underwriting are only a short term answer. • Major areas to examine- • Technology • Claims • Policy Forms / Coverage • Pricing / Underwriting
Technology • Interface with the customer needs to be better. • More data needs to be readily available. • Companies need to be able to more quickly implement changes.
Claims • Leakage has to be stopped. • Overpayment of claims. • Was repair made? • How often is subrogation sought? • More controls of vendor management. • Better feedback to the customer and to underwriting.
Policy Forms / Coverage • Should the policy revert back to true individual catastrophic coverage? • What types of coverage should be added? • Should separate policies for maintenance be sold? • How does the industry avoid black eyes when new exposures arise such as mold?
Pricing / Underwriting • There needs to be more segmentation. • Credit scoring and prior losses are a start. • More rating factors around both the customer and the dwelling need to be developed. • Pricing by peril. • Underwriting needs to be based on loss ratios, not frequency.