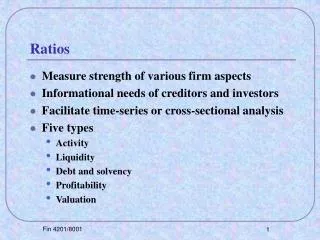
Download

1 / 7
140 likes | 586 Views
$200,000 $4,000,000. Net income sales. Net income Total assets. $200,000 $1,600,000. Net income Sales. Sales Total assets. Net income Stockholders’ equity. $200,000 $1,000,000. Return on assets (investment) (1 – Debt/Assets). 0.125 1 – 0.375. 0.10 1 – 0.33. T 3-3.

E N D
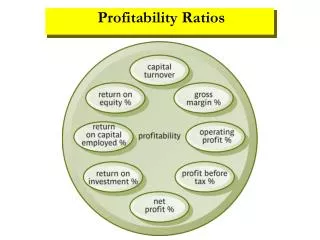
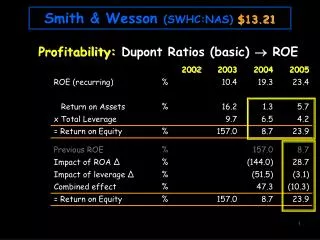
$200,000 $4,000,000 Net income sales Net income Total assets $200,000 $1,600,000 Net income Sales Sales Total assets Net income Stockholders’ equity $200,000 $1,000,000 Return on assets (investment) (1 – Debt/Assets) 0.125 1 – 0.375 0.10 1 – 0.33 T 3-3 Profitability Ratios • Saxton Company Industry Average • 1. Profit margin = = 5% 6.7% • 2. Return on assets (investment) = • a. = 12.5% 10% • b. 5% 2.5 = 12.5% 6.7% 1.5 = 10% • 3. Return on equity = • a. = 20% 15% • b. = 20% = 15%
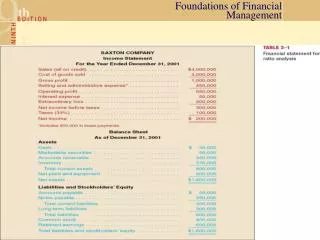
Sales (credit) Receivables $4,000,000 $350,000 $350,000 $11,111 Sales Inventory $4,000,000 $370,000 T 3-6 Asset Utilization Ratios Saxton Company Industry Average 4. Receivables turnover = = 11.4 10 times 5. Average collection period = = 32 36 days 6. Inventory turnover = = 10.8 7 times Accounts receivable Average daily credit sales
Sales Fixed assets $4,000,000 $800,000 Sales Total assets $4,000,000 $1,600,000 T 3-6 Asset Utilization Ratios Saxton Company Industry Average 7. Fixed asset turnover = = 5 5.4 times 8. Total asset turnover = = 2.5 1.5 times
Current assets Current liabilities Current assets – Inventory Current liabilities T 3-7 Liquidity Ratios Saxton Company Industry Average 9. Current ratio = = 2.67 2.1 10. Quick ratio = = 1.43 1.0 $800,000 $300,000 $430,000 $300,000
Total debt Total assets Income before interest and taxes Interest Income before fixed charges and taxes Fixed charges T 3-8 Debt Utilization Ratios Saxton Company Industry Average 11. Debt to total asets = = 37.5% 33% 12. Times interest earned = = 11 7 times 13. Fixed charge coverage = = 6 5.5 times $600,000 $1,600,000 $550,000 $50,000 $600,000 $100,000
T 3-9 Table 3-3--Ratio Analysis • Saxton Industry • Company Average Conclusion • A. Profitability • 1. Profit Margin ……………… 5.0% 6.7% Below average • 2. Return on Assets ………….. 12.5% 10.0% Above average due to high turnover • 3. Return on Equity ………….. 20.0% 15.0% Good due to ratios 2 and 10 • B. Asset Utilization • 4. Receivables turnover ……. 11.4 10.0 Good • 5. Average collection period…. 32.0 36.0 Good • 6. Inventory turnover ………... 10.8 7.0 Good • 7. Fixed asset turnover ………. 5.0 5.4 Below average • 8. Total asset turnover ………. 2.5 1.5 Good • C. Liquidity • 9. Current ratio ……………… 2.67 2.1 Good • 10. Quick Ratio ……………….. 1.43 1.0 Good • D. Debt Utilization • 11. Debt to total assets ……….. 37.5% 33.0% Slightly more debt • 12. Times interest earned ……. 11.0 7.0 Good • 13. Fixed charge coverage …... 6.0 5.5 Good