Download
1 / 1
10 likes | 123 Views
Incorporating the Wind Erosion Prediction System (WEPS) for Dust into a Regional Air Quality Modeling System Serena H. Chung 1 , Jincheng Gao 2 , Larry E. Wagner 3 , Joseph Vaughan 1 , Tim VanReken 1 and Brian K. Lamb 1

E N D
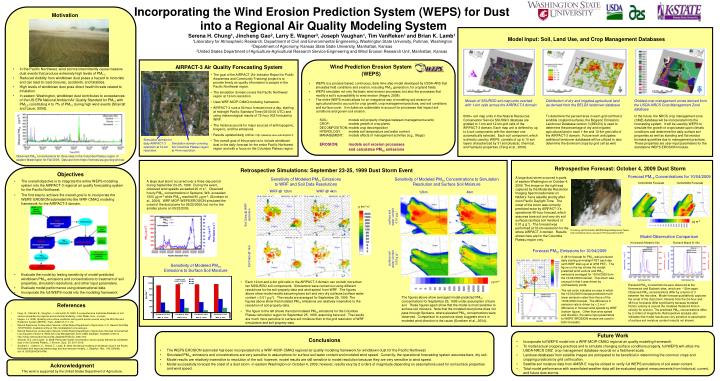
Incorporating the Wind Erosion Prediction System (WEPS) for Dust into a Regional Air Quality Modeling System Serena H. Chung1, Jincheng Gao2, Larry E. Wagner3, Joseph Vaughan1, Tim VanReken1 and Brian K. Lamb1 1Laboratory for Atmospheric Research, Department of Civil and Environmental Engineering, Washington State University, Pullman, Washington2Department of Agronomy, Kansas State State University, Manhattan, Kansas3United States Department of Agriculture-Agricultural Research Service-Engineering and Wind Erosion Research Unit, Manhattan, Kansas Model Input: Soil, Land Use, and Crop Management Databases AIRPACT-3 Air Quality Forecasting System • The goal of the AIRPACT (Air Indicator Report for Public Awareness and Community Tracking) project is to provide timely air quality information to people in the Pacific Northwest region. • The simulation domain covers the Pacific Northwest region at 12-km resolution. • Uses WRF-MCIP-CMAQ modeling framework. • AIRPACT-3 runs a 64-hour forecast once a day, starting at midnight Pacific Standard Time (08:00:00 UTC) and using meteorological results of 72-hour 00Z forecast by WRF. • The model accounts for major sources of anthropogenic, biogenic, and fire emissions. • Results updated daily online: http://www.lar.wsu.edu/airpact-3 • The overall goal of this project is to include windblown dust in the daily forecast for the entire Pacific Northwest region and with a focus on the Columbia Plateau region. Mosaic of SSURGO soil map units overlaid with 1-km cells across the AIRPACT-3 domain Distribution of dry and irrigated agricultural land as derived from the BELD3 landcover database Gridded crop management zones derived from the USDA-NRCS Crop Management Zone database 8000+ soil map units in the Natural Resources Conservation Service SSURGO database are gridded to 1-km and 12-km grid cells of the AIRPACT-3 domain. Each map unit is defined by up to 4 soil components with the dominant one automatically selected. Each soil component, which is directly used by WEPS, consists of up to 10 soil layers characterized by 31 soil physical, chemical, and hydraulic properties. (Feng et al., 2009). To determine the percent area in each grid cell that is erodible cropland surfaces, the Biogenic Emissions Landcover Database version 3 (BELD3) is used to determine the percentage of dry and irrigated agricultural land in each 1-km and 12-km grid cells of the AIRPACT-3 domain. Future work anticipates additional landcover databases will be utilized to also determine the dominant crops by grid cell as well. In the future, the NRCS crop management zone (CMZ) database will be incorporated into the forecasting system. It will be used by WEPS to simulate the growth of crops based upon climatic conditions and determine the daily surface soil properties as well as standing and flat residue biomass quantities due to management practices. These properties are user-input parameters for the standalone WEPS EROSION module. Simulation domain for daily AIRPACT-3 operation at 12-km resolution. Simulation domain covering the Columbia Plateau region at 4-km resolution. Retrospective Simulations: September 23-25, 1999 Dust Storm Event Forecast PM10 Concentrations for 10/04/2009 A large dust storm occurred in parts of eastern Washington on October 4, 2009. The image on the right was captured by the Moderate Resolution Imaging Spectroradiometer on NASA’s Terra satellite shortly after noon Pacific Daylight Time. The onset of the storm was correctly predicted twice by AIRPACT-3’s operational 48-hour forecast, which assumes bare soil and very dry soil surfaces (surface soil moisture of 0.01 g g-1). The forecast was performed at 12-km resolution for the whole AIRPACT-3 domain. Results shown here are for the Columbia Plateau region only. Sensitivity of Modeled PM10 Emissions to WRF and Soil Data Resolutions Sensitivity of Modeled PM10 Concentrations to Simulation Resolution and Surface Soil Moisture A large dust storm occurred over a three-day period during September 23-25, 1999. During the event, observed wind speeds exceeded 20 m s-1. Observed hourly PM10 concentrations in Spokane, WA exceeded 1000 g m-3 while PM2.5 reached 90 g m-3. (Sundram et al., 2004). WRF-MCIP-WEPS/EROSION simulated the onset of the dust plume for 09/25/2009, but not for the smaller plume on 09/23/2009. 10/03/2009 Forecast 10/04/2009 Forecast WRF @ 12km WRF @ 4km 12km 4km g km-2 s-1 Soil Data @ WRF resolution surface soil water content 0.01 g g-1 g m-3 Courtesy Jeff Schmaltz, MODIS Rapid Response Team. http://earthobservatory.nasa.gov/IOTD/view.php?id=40590 Model-Observation Comparison Kennewick-Metaline Site Burbank-Maple St Site Forecast PM10 Emissions for 10/04/2009 surface soil water content 0.03 g g-1 Soil Data @ 1km A 48-hr forecast for PM10 was produced daily starting at midnight PST each day (with WRF start-up at at 4PM PST). The figure on the top shows the model-predicted wind vectors and PM10 emissions averaged for 10/04/2009 from the 10/04/2009 forecast. This storm was unusual in that it was driven by northeasterly winds. The red circle indicates an area in which the 10/03/2009 forecast predicted much lower emission rates than those of the 10/04/2009 forecast. The difference in emission rate is driven by < 2 m s-1 difference in forecast wind speeds by WRF (bottom figure). Other than wind speed and direction, the same input parameters to WEPS’ EROSION module are used in both forecasts. Sensitivity of Modeled PM10 Emissions to Surface Soil Moisture • Each 12-km and 4-km grid cells in the AIRPACT-3 domain can contain more than ten SSSURGO soil components. Simulations were carried out using different resolutions for the soil-property data and wind speed from WRF. The figures above show model results assuming bare soil and very dry surfaces (surface water content = 0.01 g g-1). The results are averaged for September 25, 1999. The figures above show that modeled PM10 emissions are relatively insensitive to the resolution of soil-property data. • The figure to the left shows the total modeled PM10 emissions for the Columbia Plateau simulation region for September 25, 1999, assuming bare soil. The results are much more sensitive to surface soil moisture than to the grid resolution of WRF simulations and soil-property data. g m-3 Elevated PM10 concentrations were observed at the Kennewick and Burbank sites, which are ~12km apart. Observed PM10 concentrations differ by a factor of 3 between the two sites. Model forecast qualitatively captures the onset of the dust storm. Results from the 24-hour and 48-hour forecasts differ significantly because modeled friction velocity is around the modeled threshold friction velocity for erosion. The predicted PM10 concentrations differ by 2 orders of magnitude. Retrospective analysis also indicates that model results are very sensitive to assumption of surface soil moisture content (results not shown). The figures above show averaged model-predicted PM10 concentrations for September 25, 1999 under assumption of bare soil. These figures again show that the model is most sensitive to surface soil moisture. Note that the modeled dust plume does not pass through Spokane, where elevated PM10 concentrations were observed. Comparison to a previous study suggests errors in modeled wind direction is the cause (Sundram et al., 2004). • In the Pacific Northwest, wind storms intermittently cause massive dust events that produce extremely high levels of PM10. • Reduced visibility from windblown dust poses a hazard to motorists and can lead to road closures, accidents, and fatalities. • High levels of windblown dust pose direct health threats related to inhalation. • In eastern Washington, windblown dust contributes to exceedances of the US EPA National Ambient Air Quality Standard for PM10 with PM2.5 constituting 4 to 7% of PM10 during high wind events (Sharratt and Lauer, 2006). Motivation • Wind Prediction Erosion System • (WEPS) • WEPS is a process-based, continuous, daily time-step model developed by USDA-ARS that simulates field conditions and erosion, including PM10 generation, for cropland fields. • WEPS simulates not only the basic wind erosion processes, but also the processes that modify a soil’s susceptibility to wind erosion (Hagen, 2008). • The entire WEPS model allows for an integrative way of modeling soil erosion on agricultural land to account for crop growth, crop management practices, and soil conditions and surface cover. It includes six submodels to account for processes that impact soil conditions and govern soil erosion: • SOIL: models soil property changes between management events • CROP: models growth of crop plants • DECOMPOSITION: models crop decomposition • HYDROLOGY: models soil temperature and water content • MANAGEMENT: models effects of management activities (e.g., tillage) • EROSION: models soil erosion processes • and calculates PM10 emissions Observed PM10 concentrations for three sites in the Columbia Plateau region of eastern Washington for Fall 2009. Data are from https://fortress.wa.gov/ecy/enviwa. Retrospective Forecast: October 4, 2009 Dust Storm • Objectives • The overall objective is to integrate the entire WEPS modeling system into the AIRPACT-3 regional air quality forecasting system for the Pacific Northwest. • The first step to achieve the overall goal is to incorporate the WEPS’ EROSION submodel into the WRF-CMAQ modeling framework for the AIRPACT-3 domain. • Evaluate the model by testing sensitivity of model-predicted windblown PM10 emissions and concentrations to treatment of soil properties, simulation resolutions, and other input parameters. • Evaluate model performance using observational data. • Incorporate the full WEPS model into the modeling framework. • References • Feng, G., Sharratt, B., Vaughan, J., and Lamb, B. 2009, A comprehensive multiscale database of soil stratum properties for regional environmental modeling, J Soil Water Cons., in press. • Hagen, L.J. 2008, Updating soil surface conditions during wind erosion events using the Wind Erosion Prediction System (WEPS), Trans. ASAE 47,117-112. • Natural Resources Conservation Service, United States Department of Agriculture. U.S. General Soil Map (STATSGO2). Available online at http://soildatamart.nrcs.usda.gov. • Natural Resources Conservation Service, United States Department of Agriculture. Revised Universal Soil Loss Equation Version 2 (RUSLE2) Crop Management Zone (CMZ) database. Available online at http://fargo.nserl.purdue.edu/rusle2_dataweb/RUSLE2_Index.htm. • Sharratt, B.S. and Lauder, D. 2006, Particulate matter concentration and air quality affected by windblown dust in the Columbia Plateau, J. Environ. Qual., 35, 2011-2016. • Sundram, I., Claiborn, C., Strand, T., Lamb, B. 2004, Numerical modeling of windblown dust in the Pacific Northwest with improved meteorology and dust emission models, J. Geophys. Res., 109, D24208, doi:10.1029/2004JD004794, • Conclusions • The WEPS EROSION submodel has been incorporated into a WRF-MCIP-CMAQ regional air quality modeling framework for windblown dust for the Pacific Northwest. • Simulated PM10 emissions and concentrations are very sensitive to assumptions for surface soil water content and modeled wind speed. Currently, the operational forecasting system assumes bare, dry soil. • Model results are relatively insensitive to resolution of the soil; however, model results are still sensitive to model resolution because they are very sensitive to wind speed. • Model successfully forecast the onset of a dust storm in eastern Washington on October 4, 2009; however, results vary by 2 orders of magnitude depending on assumptions used for soil surface properties and wind speed. • Future Work • Incorporate full WEPS model into a WRF-MCIP-CMAQ regional air quality modeling framework. • To model actual cropping practices and to simulate changing surface conditions properly, full WEPS will utilize the USDA-NRCS CMZ crop management database records on a field level scale. • Landuse databases from satellite images are anticipated to be beneficial in determining the common crops and cropping practices by grid cell location. • Satellite soil moisture data from AMSR-E may be utilized to verify full WEPS simulations of soil water content. • Total model performance with assimilated weather data will be evaluated against measurements from historical, current, and future dust storms. Acknowledgment This work is supported by the United States Department of Agriculture.