Download
1 / 14
140 likes | 215 Views
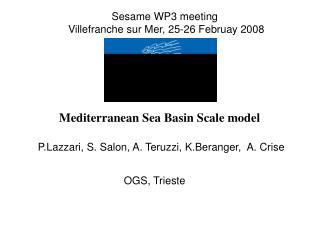
Energy Situation and Prospects in the Mediterranean Basin. August 2000. Others. Morocco. Maghreb. Algeria. Tunisia. Libya. Egypt. Turkey. 2. Demography by Country in the SEMCs. 400. 300. 200. millions inhabitants. 100. 0. 1970. 1980. 1990. 2000. 2010. 2020. February 2000.

E N D
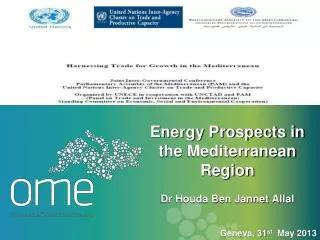
Energy Situation and Prospects in the Mediterranean Basin August 2000
Others Morocco Maghreb Algeria Tunisia Libya Egypt Turkey 2 Demography by Country in the SEMCs 400 300 200 millions inhabitants 100 0 1970 1980 1990 2000 2010 2020 February 2000 Source: OME
Source: OME February 2000 3
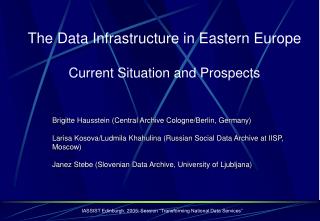
Source: OME February 2000 4 Energy Consumption Growth in the Mediterranean 900 1,2%/y 775 710 600 600 4,3%/y 2,0%/y 495 Mtoe 390 349 300 6,1%/y 210 42 0 197019982010 2020 197019982010 2020 SEMCs NMCs
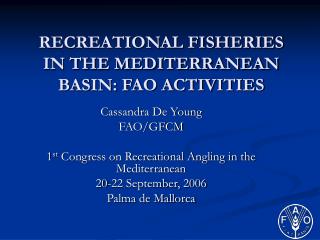
Primary Energy Demand in the SEMCs 400 Others Morocco Algeria 200 Tunisia Mtoe Libya 100 Egypt Turkey 0 1970 1980 1990 2000 2010 Source: OME February 2000 5 300
Primary Energy Consumption per Capita in the Mediterranean (koe per capita) 2020 2010 1998 1970 3785 3502 NMCs 2898 1967 2020 2010 1998 1970 1527 1318 SEMCs 889 343 koe per capita 0 500 1000 1500 2000 2500 3000 3500 4000 4500 Source: OME February 2000 6
Energy Share by Source in the Mediterranean Energy Balance 7 1998 (810 Mtoe) Hydro Coal Nuclear 3% 13% 14% Oil 51% Gas 19% 2010 (1100 Mtoe) Hydro 3% Coal 14% Nuc. 11% Gas 28% Oil 44% Source: OME February 2000
Energy Share by Source in the SEMCs Energy Balance 8 1998 (210 Mtoe) Hydro 3% Coal 16% Gas 23% Oil 58% 2010 (390 Mtoe) Nuclear 1% Hydro 3% Coal 18% Gas 35% Oil 43% Source: OME February 2000
Source: OME February 2000 9 Primary Energy Consumption in the SEMCs by Source 500 Hydro Nuclear 400 N.Gas 300 200 Mtoe Oil 100 Coal 0 1970 1980 1990 2000 2010 2020
Source: OME February 2000 10 Primary Energy Consumption in the NMCs by Source 800 Hydro Nuclear 600 N.Gas Mtoe 400 Oil 200 Coal 0 1970 1980 1990 2000 2010 2020
Natural Gas Reserves & Resources in the Mediterranean 11b 500 300 200 400 85 250 4000 3800 1350 3000 1000 2000 Reserves Resources Source:Conférence Arabe Energie-Damas 1998 pour réserves, et OME/Masters pour ressources
12 Electricity Demand in the Mediterranean Basin 2700 2400 2100 1800 SEMCs 1500 TWh 1200 900 NMCs 600 300 0 1970 1980 1990 2000 2010 2020 Source: OME February 2000
13 Electricity Demand in the Mediterranean Basin 1800 1,6%/y 1555 1500 1360 1200 5,9%/y 4,0%/y 1110 1072 900 TWh 712 600 8,4%/y 388 302 300 34 0 197019982010 2020 197019982010 2020 SEMCs NMCs Source: OME February 2000
Electricty Consumption per Capita in the Mediterranean Basin (kWh per capita) 7534 2020 2010 1998 1970 6734 NMCs 5550 2183 2020 2010 1998 3103 2429 SEMCs 1311 283 kWh per capita 0 1000 2000 3000 4000 5000 6000 7000 8000 Source: OME February 2000 14