Download
1 / 38
380 likes | 400 Views
Gene Expression. Expressed genes are those that have been transcribed. A gene expression profile of a cell is the snapshot of which genes are expressed in that cell at the time the sample was taken. Knowing which genes are expressed in a cell allows: identification of new genes or transcripts

E N D
Gene Expression Expressed genes are those that have been transcribed. A gene expression profile of a cell is the snapshot of which genes are expressed in that cell at the time the sample was taken. Knowing which genes are expressed in a cell allows: identification of new genes or transcripts comparison of expression profiles between samples Main motives: disease, development, dynamic responses in that cell at that time
Differential Gene Expression Expression profile of genes in one sample vs another. Different cells, tissues, disease states, developmental stages, culture conditions, etc, can be compared. Measure both, subtract the overlap, obtain the difference, interpret it. Pay due attention to controls, negative and positive Pay due attention to range of variability within samples High throughput and higher throughput
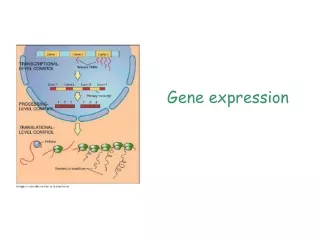
Differential Gene Expression Workflow • Formulate the biological questions • Experimental design Which platform, which controls, how many replicates • Run the experiment • Image processing (by machine) • Low-level analysis Data preprocessing (normalisation step) • High-level analysis Data analysis • Reach biological conclusions Interpretation of results
High Throughput Methods- Advantages Fast a lot of data produced quickly Comprehensive entire genomes in one experiment Easy submit RNA samples to a core facility Cost getting cheaper still
High Throughput Methods - Disadvantages Cost - Some researchers can’t afford to do appropriate numbers of controls, replicates RNA - The final product of gene expression is a protein Significance - How do you filter out non-coding RNA, or transcripts that are not translated? Quality - Artifacts with image analysis and data analysis Control - Not enough attention to experimental design - Need more collaboration with computational scientists
Measuring Differential Gene Expression • Quantification of mRNA transcripts • EST libraries • SAGE libraries • Microarray technology • High throughput RNA-seq technology • trancriptomesequencing • ( quantification of mRNA transcripts)
EST Libraries • Expressed Sequence Tags • Single sequencing reads from cDNA libraries- • 250 (earlier) - 800 (later) bases long • usually from 5’ or 3’ end according to cloning strategies • an indication of which mRNA are in that cell at that time • Highly expressed genes = many ESTs • Low expression genes = fewer (or no detectable) ESTs • Can miss very low level transcripts, and some transcript variants • OK for quantification, known inaccuracies inherent in the method • Not OK for discovery of rare transcripts, too much noise from common transcripts • dbEST at NCBI
SAGE Libraries Serial analysis of gene expression 14 bp fragment is enough to uniquely identify a transcript. Make cDNA library, cut it to 14bp fragment per transcript. Ligate tags into long concatemers separated by a marker, and sequence them. Output is a quantifiable list of short tags denoting presence of a gene and how much of it is there. Useful in comparing transcriptomes and in discovery of new genes or transcripts
Microarray Technology • Single stranded lawn of DNA probes attached to a membrane on a microarray chip • Usually 20-30 bp of a unique sequence from a gene. Often have more than one probe representing a gene. • Target (hybridization extract) • Total cDNA extracted from biological sample and labeled with fluorescent dye • Targets hybridise to the probes that have complimentary sequences. Intensity of hybridization is measured as an indication of the presence of that gene in the biological sample.
Uses of microarrays • Changes in Gene Expression levels (one or two colours) • Probes are ssDNA (cDNA or oligos), • Target is labeled cDNA derived from mRNA.
Uses of microarrays • Genomic Gains and Losses (two colours) • CGH (Comparative Genomic Hybridization) • Probes are ssDNA (oligos) • Target is labeled DNA derived from genomic DNA
Uses of microarrays • Genomic SNPs (one colour) • Probes are short genomic sequences containing SNPs • Target is labeled DNA derived from genomic DNA
Image Processing This is computerized - you just see the final result in a spreadsheet. The software scans the array and quantitates the signal values, i.e. converts fluorescence intensity to digital value
Data Preprocessing You choose the parameters, software does the work • Background subtraction: Eliminates background noise • Normalization: This step takes care of • Unequal quantity of starting sample • Difference in labeling efficiency • Difference in detection efficiency • System biases, etc. Brings all samples into a similar range of distribution • Statistical QC Removes low quality samples and probesets
Detection of Significantly Differentially Expressed Genes Statistical tests • Student’s t test for two conditions/groups (control vs treated) (i.e. the comparison of the means and standard deviations of two bell shaped curves, based on a t-statistic, testing the null-hypothesis that both distributions came from the same distribution) • ANOVA analysis (control vs treatment 1 vs treatment 2) (i.e. ANalysis Of VAriances: Allows to test the null hypothesis that the differences within and between at least 3 groups are the same on average. Based on F-statistic, the ratio of the variance calculated among the means to the variance within the samples)
Detection of Significantly Differentially Expressed Genes • 2-way ANOVA (eg 2 cell lines, 2 treatments) (i.e. The two-way ANOVA compares the mean differences between groups that have been split on two independent variables called factors. The primary purpose of a two-way ANOVA is to understand if there is an interaction between the two independent variables on the dependent variable). • SAM analysis (Signifiance Analysis of Microarrays) Significant genes are determined through permutation tests.
Detection of Significantly Differentially Expressed Genes • All these methods produce p-values to assess the probability to obtain the result by chance. Problem: What happens if we have many such tests? • Multiple testing problem: • Say you have a set of hypotheses that you wish to test simultaneously. Let’s, consider a case where you have 20 hypotheses to test, and a significance level of a = 0.05. What’s the probability of observing at least one significant result just due to chance? • P(at least one significant result) = 1 − P(no significant results) • = 1−(1−0.05)20 • ≈ 0.64 • We have a 64% CHANCE to find one significant result randomly …
Detection of Significantly Differentially Expressed Genes • Correction methods: • Bonferroni (very conservative): significance threshold is a/N • FDR (False Discovery Rate): check if the kth ordered p-value is larger than (k × a)/N • q-value: chance that p-values in this column are false positives: q-value
Detection of Significantly Differentially Expressed Genes Fold change • Difference in the intensity of a sample vs control or another sample, indicative of difference in level of expression of the gene • Threshold > 2, or > 1.6 in some cases
Then clustering In differential gene expression, you are looking for genes that behave differently between one sample and another, either up- or down- Once you get your DE gene set, you group the genes according to similar expression, and the outliers become more obvious Clustering methods similar to those of phylogenetics, but without the evolutionary weightings, ie distance matrices More downstream analysis later in the course
RNA-seq Same concept as sequencing ESTs and counting SAGE tags, but does not stop at short segments and tags. What is being sequenced is the cDNA from the mRNA component. Sequencing of whole transcriptome of a sample (NGS), and comparing it against the whole transcriptome of another sample. Costly, informative, bioinformatics not yet fully sorted out- when does a lot of data become too much data?
It’s all about the alignment First, you align your reads to a reference genome or genomic region (or assemble the reads de novo) BWA, Bowtie2, etc Then you use a splice-aware aligner, such as TopHat or STAR, to refine the aligments according to coding sequences (exons) using known and/or predicted splice junctions
Quantifying reads per gene • Your aim is to count sequence reads per gene • When mapping reads to genome: • Filter out rRNA, tRNA, mitRNA, etc • Filtering out (or in!) non-coding RNA • Deal with alternative splicing • Deal with overlapping genes, pseudogenes • Small reads mean many short overlaps at one end or the other of intron gaps • Allele specific gene expression
Some Solutions c.f. S. Brown, NYU • Can create a library of transcripts and map reads to transcripts (still have some ambiguity for multiple isoforms) [limited, few(if any) use this method] • Can create a library of splice-junctions (span intron gaps) [Illumina CASAVA uses this method] • Can predict transcripts from genome mapped RNA-seq reads plus known splice junctions plus predicted splice junctions [TopHat] • Can do de novo assembly of new transcripts from reads [Trinity]
Normalization c.f. S. Brown, NYU Coverage is not exactly the same for each sample • Problem: Need to scale RNA counts per gene to total sample coverage • Solution – divide counts per million reads • Problem: Longer genes have more reads, gives better chance to detect DE • Solution – divide counts by gene length • Result = RPKM and later FRKM (Reads/Fragments Per KB per Million)
Better Normalization c.f. S. Brown, NYU • FPKM assumes: • Total amount of RNA per cell is constant • Most genes do not change expression • FPKM is invalid if there are a few very highly expressed genes that have dramatic change in expression (dominate the pool of reads) • Many now use “Quantile” normalization • New normalization methods currently being published • Different normalization methods give different results
Better Normalization quantilenormalization: making distributions identical in statistical properties arrays genes rearrange columns assign ranks arrays genes rank values assign values c.f. S. Brown, NYU
Statistics of Differential Gene Expression c.f. S. Brown, NYU mRNA levels are variable in cells/tissues/organisms over time/treatment/tissue etc. Need enough replicates to separate biological variability from experimental variability If there is high experimental variability, then variance within replicates will be high, statistical significance for DE will be difficult to find. Best methods to discover DE are coupled with sophisticated approaches to normalization Very low expressing genes are tricky: FPKM<1
Gene ExpressionAnalysis Databases: GEO from NCBI ArrayExpress from EBI Commercial software: GeneSpring GX, CLC Bio, many others Free: Mostly R based Not being scared of statistics is an advantage New methods and algorithms continually being published Routine experiments are routine, innovative methods more care The really tricky part is the interpretation of the results
https://github.com/ccsstudentmentors/tutorials/wiki/CCS-Student-Mentors---Tutorialshttps://github.com/ccsstudentmentors/tutorials/wiki/CCS-Student-Mentors---Tutorials