Download
1 / 1
30 likes | 199 Views
10001, Anoka county, 110, 150, 134, … etc.,. 10002, Anoka county, 110, 150, 134, … etc.,. 10003, Anoka county, 110, 150, 134, … etc.,. 1990 NDVI Profile Metrics Image (11 layers). 1990 NDVI Profile Image (14 layers). Client. Server. One Authorized user.

E N D
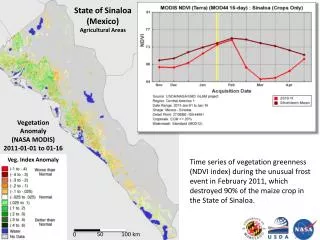
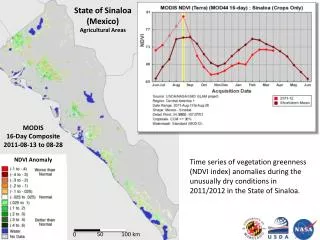
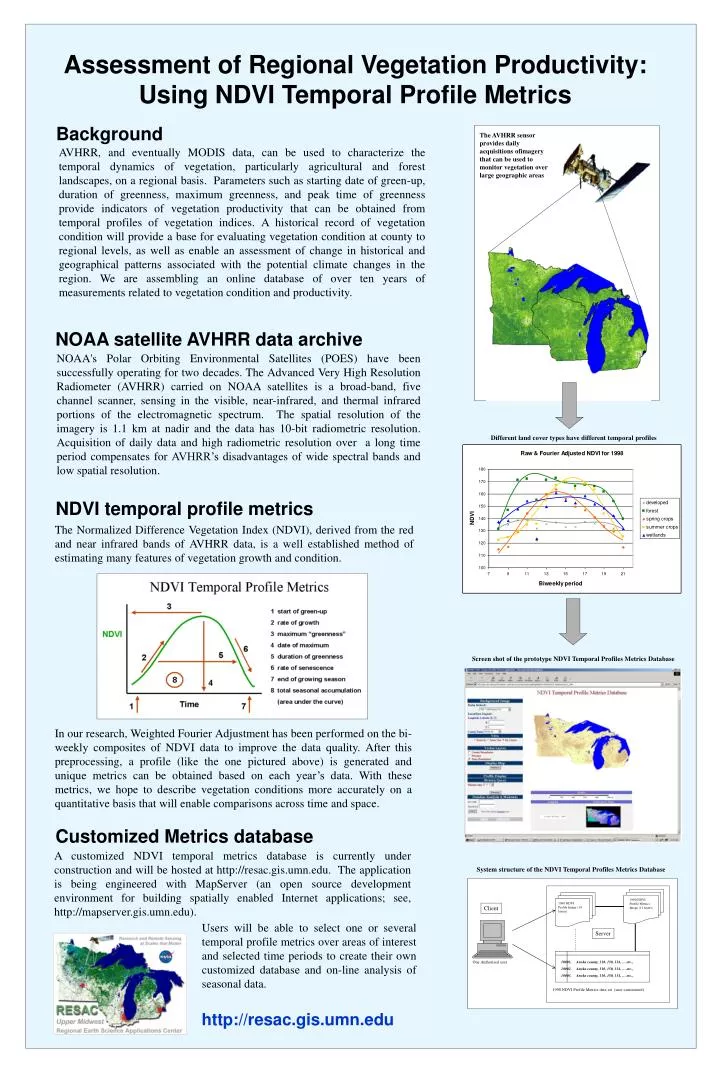
10001, Anoka county, 110, 150, 134, … etc., 10002, Anoka county, 110, 150, 134, … etc., 10003, Anoka county, 110, 150, 134, … etc., 1990 NDVI Profile Metrics Image (11 layers) 1990 NDVI Profile Image (14 layers) Client Server One Authorized user 1990 NDVI Profile Metrics data set (user customized) Assessment of Regional Vegetation Productivity:Using NDVI Temporal Profile Metrics Background The AVHRR sensor provides daily acquisitions ofimagery that can be used to monitor vegetation over large geographic areas AVHRR, and eventually MODIS data, can be used to characterize the temporal dynamics of vegetation, particularly agricultural and forest landscapes, on a regional basis. Parameters such as starting date of green-up, duration of greenness, maximum greenness, and peak time of greenness provide indicators of vegetation productivity that can be obtained from temporal profiles of vegetation indices. A historical record of vegetation condition will provide a base for evaluating vegetation condition at county to regional levels, as well as enable an assessment of change in historical and geographical patterns associated with the potential climate changes in the region. We are assembling an online database of over ten years of measurements related to vegetation condition and productivity. NOAA satellite AVHRR data archive NOAA's Polar Orbiting Environmental Satellites (POES) have been successfully operating for two decades. The Advanced Very High Resolution Radiometer (AVHRR) carried on NOAA satellites is a broad-band, five channel scanner, sensing in the visible, near-infrared, and thermal infrared portions of the electromagnetic spectrum. The spatial resolution of the imagery is 1.1 km at nadir and the data has 10-bit radiometric resolution. Acquisition of daily data and high radiometric resolution over a long time period compensates for AVHRR’s disadvantages of wide spectral bands and low spatial resolution. Different land cover types have different temporal profiles NDVI temporal profile metrics The Normalized Difference Vegetation Index (NDVI), derived from the red and near infrared bands of AVHRR data, is a well established method of estimating many features of vegetation growth and condition. Screen shot of the prototype NDVI Temporal Profiles Metrics Database In our research, Weighted Fourier Adjustment has been performed on the bi-weekly composites of NDVI data to improve the data quality. After this preprocessing, a profile (like the one pictured above) is generated and unique metrics can be obtained based on each year’s data. With these metrics, we hope to describe vegetation conditions more accurately on a quantitative basis that will enable comparisons across time and space. Customized Metrics database A customized NDVI temporal metrics database is currently under construction and will be hosted at http://resac.gis.umn.edu. The application is being engineered with MapServer (an open source development environment for building spatially enabled Internet applications; see, http://mapserver.gis.umn.edu). System structure of the NDVI Temporal Profiles Metrics Database Users will be able to select one or several temporal profile metrics over areas of interest and selected time periods to create their own customized database and on-line analysis of seasonal data. http://resac.gis.umn.edu