Download
1 / 25
260 likes | 422 Views
ASSESSMENT OF EU12 COUNTRIES’ EFFICIENCY USING MALMQUIST PRODUCTIVITY INDEX. Michaela Staníčková Department of European Integration, Faculty of Economics, VŠB-Technical University of Ostrava 16. 9. 2013. CONTENT. INTRODUCTION THEORETICAL BACKGROUND OF EFFICIENCY ANALYSIS

E N D
ASSESSMENT OF EU12 COUNTRIES’ EFFICIENCY USING MALMQUIST PRODUCTIVITY INDEX Michaela Staníčková Department of European Integration, Faculty of Economics, VŠB-Technical University of Ostrava 16. 9. 2013
CONTENT • INTRODUCTION • THEORETICAL BACKGROUND OF EFFICIENCY ANALYSIS • A. Background of Efficiency Analysis • B. Problematic of Efficiency Evaluation • DEA APPROACH FOR EFFICIENCY ANALYSIS • A. DEA Background for Measuring National Efficiency • B. Fundamental Characteristics of Empirical Analysis • APPLICATION OF DEA METHOD TO EFFICIENCY ANALYSIS OF EU12 COUNTRIES • CONCLUSION
Aim of the paper: • The aim of the paper is to measure efficiency changes over the references periods and to analyse a level of productivity in individual EU12 countries based on the Malmquist Index, and then to classify EU12 countries according to efficiency results. • Research premises (assumptions): • The efficiency is perceive like a „mirror“ of competitiveness. • DEA method evaluates the efficiency of countries with regard to their ability to transform inputs into outputs → countries achieving best (better) results in efficiency coefficients are countries best (better) at converting inputs into outputs. • Countries achieving greater level of efficiency = better using of competitive advantages = better competitive potential and perspectives. • Research hypothesis: • More advanced Central European countries achieving best results in efficiency (especially Visegrad countries and Slovenia) are countries best at converting inputs into outputs and therefore having greater performance and productive potential than less advanced EU12 countries (Balkan and Baltic countries). • I. INTRODUCTION
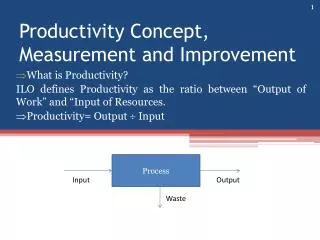
In recent years, the topics about measuring and evaluating of competitiveness and efficiency have enjoyed economic interest. • No uniform definition and understanding of these terms, these multidimensional concepts remain ones of the basic standards of performance evaluation and there are also seen as a reflection of success of area in a wider comparison. • Performance, efficiency and competitiveness are complementary objectives, which determine the long-term development of area/organization. • Performance management is one of the major sources of sustainable national efficiency and effectiveness. • II. THEORETICAL BACKGROUND OF EFFICIENCY ANALYSIS (i)
Efficiency and effectiveness analysis is based on the relationship between the inputs (entries), the outputs (results) and the outcomes (effects). • Efficiency is given by the ratio of inputs to outputs, but there is difference between the technical efficiency and the allocative efficiency. • Effectivenessimplies a relationship between outputs and outcomes. • II. THEORETICAL BACKGROUND OF EFFICIENCY ANALYSIS (ii) Fig. 1 The relationship between the efficiency and the effectiveness Source: [9], p. 3
Techniques to measure efficiency are improved and investigations of efficiency become more frequent. Nevertheless, the measurement of efficiency and effectiveness of countries resp. their factors, remains a conceptual challenge, because there are difficulties in measuring efficiency and effectiveness. • M.J. Farrell [1957], proposed an activity analysis approach for single input/output situations. • Twenty years after Farrell’s model, and building on those ideas, A.Charnes, W. W. Cooper and E. Rhodes[1978] introduced a powerful methodology which has been titled Data Envelopment Analysis (DEA) in the form of CCR model assuming constant returns to scale (CRS). DEA was proposed to assess the relative efficiencies of multi-input/multi-output production units. • The performance of countries can be evaluated in either a cross-sectional or a time-series manner, and the DEA is a useful method for both types of efficiency evaluation. • II. EVALUATION OF EFFICIENCY (iii)
Measuring the efficiency level of evaluated countries is based on following procedure: • III. DEA APPROACH FOR EFFICIENCY ANALYSIS(i) Source: Own elaboration, 2013 • Data Envelopment Analysis (DEA) method – developed/advancedapproach: Malmquist index based on input oriented Charnes-Cooper-Rhodes (IO CCR CRS) model. • Number of performance measures? - Empirically, when the number of performance measures is high in comparison with the number of DMUs, then most of DMUs are evaluated efficient – in basic models, not in multi-period MI.
III. DEA APPROACH FOR EFFICIENCY ANALYSIS(ii) • Territorial definition: • 12 countries – „new“ EU MemberStates(withoutCroatia); national level • Reference period: • reference years 2000 (beginning of growth period) and 2011 (last year ofcomplete data-base for all evaluated countries; post-crisis year) • reference periods for MI: 2000-2007, 2007-2008, 2008-2011, 2000-2011 • Indicators: • 66 selected indicators (38 inputs, 28 outputs) – 62 used indicators (37 inputs, 25 outputs) • Database indicators: based on Country Competitiveness Index(CCI) - pillars of CCI are grouped according to the different dimensions (input versus output aspects) of national competitiveness they describe. ‘Inputs’ and ‘outputs’ are meant to classify pillars into those which describe driving forces of competitiveness, also in terms of long-term potentiality, and those which are direct or indirect outcomes of a competitive society and economy Eurostat, World Bank, Euro barometer, Organisation for Economic Co-operation and Development (OECD), European Cluster Observatory.
The Malmquist index (MI) measures the efficiency changeof production of unit M0 between successive periods t and t+1 • M0 (xt+1, yt+1, xt, yt) • We can decompose MI (M0) into two components: • M0 = TEC0 . TSF0 • TEC0 =the change of technical efficiency =is change in the relative efficiency of unit DMU0 in relation to other units (i.e. due to the production possibility frontier) between time periods t and t+1, • TSF0= the change of technology efficiency = describes the change in the production possibility frontier as a result of the technology development between time periods t and t+1. • III. DEA APPROACH FOR EFFICIENCY ANALYSIS (iv)
TEC0 =the change of technical efficiency= • TSF0= the change of technology efficiency= • III. DEA APPROACH FOR EFFICIENCY ANALYSIS (v) = function that assigns for productionunit 0 degree of effectiveness in timetwith input x and outputy
III. DEA APPROACH FOR EFFICIENCY ANALYSIS (vii) • Model A • Model B min min subject to subject to
III. DEA APPROACH FOR EFFICIENCY ANALYSIS (viii) • Model C • Model D min min subject to subject to
The initial hypothesis of efficiency being a mirror of competitive potential was partlyconfirmedthrough analysis by Malmquist index. • Some of countries have reached the best results and recorded predominantly total efficiency increase through the time period and other countries have reached predominantly total efficiency decrease during reference years. • Most of evaluated countries have recorded both increasing and decreasing trend in efficiency development during reference years of period 2000-2011 and 2000-2007, but in years 2007-2008, most of countries have recognized considerable deterioration in efficiency (due to economic crisis). • It is recognized gradually improving in economic development in years 2008-2011, but it is very slow. • Apparently the best results are traditionally achieved by economically powerful countries which were ‘efficient’ or ‘highly efficient’ during the reference periods. • IV. APPLICATION OF DEA METHOD TO EFFICIENCY ANALYSIS OF EU MEMBER STATES (i)
IV. APPLICATION OF DEA METHOD TO EFFICIENCY ANALYSIS OF EU MEMBER STATES (ii) Source: Own calculation and elaboration, 2013 ‘Efficient’ countries’: Slovenia ‘Highly efficientcountries’: Czech Republic, Slovakia, Poland, Malta, Latvia ‘Slightly inefficient countries’: Estonia, Cyprus, Lithuania ‘Inefficientcountries’: Bulgaria, Romania, Hungary
IV. APPLICATION OF DEA METHOD TO EFFICIENCY ANALYSIS OF EU MEMBER STATES (iii) Source: Own calculation and elaboration, 2013
IV. APPLICATION OF DEA METHOD TO EFFICIENCY ANALYSIS OF EU MEMBER STATES (iv) Source: Own calculation and elaboration, 2013
MI = 2000-2011 • IV. APPLICATION OF DEA METHOD TO EFFICIENCY ANALYSIS OF EU MEMBER STATES(v) • MI = total productivity efficiency change • TEC = the change of technical efficiency • TSF = the change of technology efficiency Source: Own calculation and elaboration, 2013
MI = 2000-2007 • IV. APPLICATION OF DEA METHOD TO EFFICIENCY ANALYSIS OF EU MEMBER STATES(vi) • MI = total productivity efficiency change • TEC = the change of technical efficiency • TSF = the change of technology efficiency Source: Own calculation and elaboration, 2013
MI = 2007-2008 • IV. APPLICATION OF DEA METHOD TO EFFICIENCY ANALYSIS OF EU MEMBER STATES(vii) • MI = total productivity efficiency change • TEC = the change of technical efficiency • TSF = the change of technology efficiency Source: Own calculation and elaboration, 2013
MI = 2008-2011 • IV. APPLICATION OF DEA METHOD TO EFFICIENCY ANALYSIS OF EU MEMBER STATES(viii) • MI = total productivity efficiency change • TEC = the change of technical efficiency • TSF = the change of technology efficiency Source: Own calculation and elaboration, 2013
Applying DEA method presents a convenient (possible) way of comparing efficiency across DMUs atnational (country) level. • Based on the DEA methodhas been found out: • there is a distinct gap between economic and social standards in terms of evaluated countries, so differences still remain; • according to MI results, in EU12countries was mostly achieved noticeable productivity decreases and performance deteriorating during reference years; • more or less balanced performance and efficiency trend were recognized duringthereference periods; • most countries experienced decline in their performance as a result of economic crisis. The economic crisis has threatened the achievement of sustainable development in the field of competitiveness. The crisis has underscored importance of competitiveness-supporting economic environment to enable economies better absorb shocks and ensure solid economic performance going in future. • Subsequentresearch orientation: • analysis of distance fromefficientfrontierthroughmacroeconomic modelling tofindingthe common and individual trends of macroeconomic efficiency; • analysis of slacksforoptimalsettings of inputs and outputsfor each country in a given period of time. • V. CONCLUSION
€UR Katedra evropské integrace • Acknowledgement • Thank You for Your Attention Q/A Comments Suggestions Michaela Staníčková michaela.stanickova@vsb.cz Department of European Integration Faculty of Economics, VŠB-Technical University of Ostrava