Download

1 / 16
170 likes | 304 Views
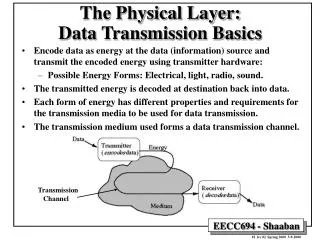
Primary Data: The Basics. Jeremy Kees, Ph.D. Formulate Problem. Stages in the Research Process. Determine Research Design. Design Data Collection Method and Forms. Design Sample and Collect Data. Analyze and Interpret the Data. Prepare the Research Report. Types of Primary Data :

E N D
Primary Data:The Basics Jeremy Kees, Ph.D.
Formulate Problem Stages in the Research Process Determine Research Design Design Data Collection Method and Forms Design Sample and Collect Data Analyze and Interpret the Data Prepare the Research Report
Types of Primary Data: Demographic / Socioeconomic Characteristics Psychological / Lifestyle Characteristics Attitudes / Opinions Awareness / Knowledge Intentions Motivation Behavior What, how much, where, when, how, who Purchase behavior vs. use behavior E.g., --- basic hierarchy of effects models Primary Data: Overview
Qualities of Primary Data: Versatility Can be obtained quickly Data quality: objectivity and accuracy Primary Data: Overview
Two Classes of Primary Data Observation Communication Primary Data: Overview
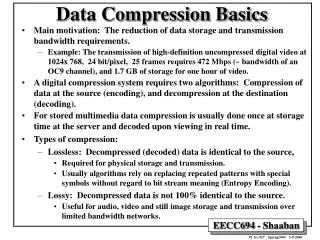
Degreeof Structure Structured Unstructured Degreeof Disguise Disguised Undisguised Communication Personal Interview Telephone Interview Mail Questionnaire Methodof Administration Degreeof Structure Structured Unstructured Degreeof Disguise Disguised Undisguised Observation Setting Natural Contrived Method of Administration Human Mechanical Decisions, Decisions
Structured Unstructured Typical Questionnaire (very frequently used) Interviews Open-EndedQuestions Undisguised leastused MotivationResearch WordAssociation SentenceCompletion StoryTelling Disguised Structure and Disguise Decisions
Trade-Offs Among Methods of Survey Administration HIGHLY VERSATILE LIMITED phone fax mail email web personal (e.g., mall, home) LOW COST HICOST personal fax web mail phone email FAST TURN- AROUND SLOW web mail fax personal phone email
Demographics are starting to look similar: mall internet panel tests tests members household size 2.8 2.9 3.0 average age 40.5 39.2 37.2 employed 71% 72% 69% white 86% 88% 89% male 20% 21% 15% college 40% 43% 46% Correlation between Responses: mall vs. internet internet test/retest reliability purchase intent .86 .94 frequency .94 .97 liking .85 .91 price / value .90 .99 Mall Intercepts vs. E-Panels Responses to marketing questions show: 1) strong consistency (reliability measured as the correlation between responses over two survey occasions) and 2) correlations between sample methodologies suggests modality is not critical and should not create bias
Internet Phone Time survey took to administer 12.5 19.4 minutes Upon completion, would respondent participate in future studies? 35% yes 26% yes More experienced Internet Users x Used rating scale extreme “endpoints” more frequently x E-Panels vs. Phone Jeff Miller and Alan Hogg “Internet vs. Telephone Data Collection” Burke White Paper series 2 (4) (www.burke.com). Also see Ashok Ranchhod and Fan Zhou “Comparing Respondents of E-Mail and Mail Surveys,” Marketing Intelligence & Planning 19 (2001), 254.
Basic Question Formats • Open-ended question • Unprobed format: seeks no additional information • Probed format: includes a response probe instructing the interviewer to ask for additional information
Basic Question Formats • Close-ended question • Dichotomous: has only two response options, such as “yes” or “no” • Multiple response: has more than two options for the response • Scaled-response: utilizes a scale developed by the researcher to measure the attributes of some construct under study • Labeled vs. Unlabeled
Other Considerations… • The nature of the property being measured • Previous research studies • The data collection mode • The ability of the respondent • The scale level desired…
Types of Scales • Nominal scales: those that use only labels • Ordinal scales: those with which theresearcher can rank-order the respondents or responses • Interval scales: those in which the distance between each descriptor is equal • Ratio scales: ones in which a true zero exists
Nominal Which of the soft drinks in the following list do you like? (Check ALL that apply): ___Coke ___Dr. Pepper ___Mountain Dew ___Pepsi ___Seven Up ___Sprite Ordinal Rank the soft drinks according to how much you like each (most preferred drink = 1, and least preferred drink = 6): ___Coke ___Dr. Pepper ___Mountain Dew ___Pepsi ___Seven Up ___Sprite Interval Please indicate how much you like each soft drink by checking the appropriate position on the scale: dislike like a lot dislike like a lot Coke ____ ____ ____ ___ Dr. Pepper ____ ____ ____ ___ Mountain Dew ____ ____ ____ ___ Pepsi ____ ____ ____ ___ Seven Up ____ ____ ____ ___ Sprite ____ ____ ____ ___ Ratio Please divide 100 points among these soft drinks To represent how much you like each: ___Coke ___Dr. Pepper ___Mountain Dew ___Pepsi ___Seven Up ___Sprite 100 Examples… 15
Thinking Ahead… What analysis technique is used when… • There are 2 nominally scaled variables • There are 2 intervally (or ratio) scaled variables • There is one DV that your trying to predict or explain with multiple interval variables (the independent variables) • You are checking for differences between 2 groups (nominal) for an interval scaled variable • You are checking for differences between 4 stores on total $ sales across 4 categories? Potential Answers --- t-test; multiple regression, oneway ANOVA, factorial ANOVA, correlation, crosstabs, multivariate analysis of variance