Download

1 / 68
730 likes | 826 Views
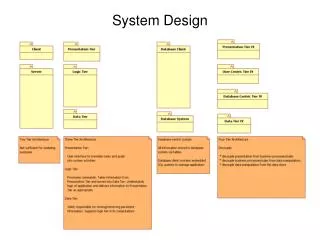
version 3. Changeability in System Design. University of Cambridge Engineering Design Center (EDC). Olivier L. de Weck, Ph.D. deweck@mit.edu Associate Professor of Aeronautics & Astronautics and Engineering Systems. April 30, 2007. Outline. Some Experiences with Change Propagation

E N D
version 3 Changeability in System Design University of Cambridge Engineering Design Center (EDC) Olivier L. de Weck, Ph.D. deweck@mit.edu Associate Professor of Aeronautics & Astronautics and Engineering Systems April 30, 2007
Outline • Some Experiences with Change Propagation • Swiss F/A-18 Aircraft Program (1991-1997) • Design for Changeability • Literature Review • Change Propagation Analysis – Recent Results • Analysis of a 9-year sensor system design project • Motifs and change patterns • Time Permitting: • Time-Expanded Decision Networks • Time-expanded network theory • Application to evolvable NASA launch vehicle design • Discussion
(1993) Swiss Version interceptor 5000 flight hours 40 min average sortie max 9.0g positive “Redesign” (Switch) Swiss F/A-18 Experience (1987) U.S. Navy Version C/D • Approach • Apply new operational usage spectrum to existing configuration • Find those locations in the system which do not comply • Apply selective, prioritized local redesign one-element-at-a-time • Example: Center barrel, wing-carry-though bulkheads Al Ti fighter and attack 3000 flight hours 90 min average sortie max 7.5g positive
F/A-18 Center Barrel Section Y488 Y470.5 Wing Attachment Y453 74A324001
Manufacturing Processes Changed Original Change Fuselage Stiffened Flight Control Software Changed Center of Gravity Shifted Gross Takeoff Weight Increased F/A-18 Complex System Change F/A-18 System Level Drawing
F/A-18 Lessons Learned • Changes increased cost per aircraft by O(~$10M) • encountered “surprises” along the way • Changing a system (or product) after its initial design is • often required to accommodate new requirements • expensive, and time-consuming if change was not anticipated in the original design • Change propagation • some changes are local and remain local • other changes start local, but propagate through the system in complex, unanticipated ways • “Switching costs” include: engineering redesign cost, change in materials, manufacturing changes, change in operational costs, recertification, others …
Examples • Communications Satellite Constellations [Chaize et al. 2003] • Iridium Bankruptcy [1999, $5B], Globalstar similar fate • Oversized System based on optimistic market forecasts, could not easily adapt capacity, service, footprint … • We’ve studied previously how to deploy them in stages • Automotive Platforms [Suh et al. 2005] • General Motors, e.g. Epsilon Platform [2003-2013+] • Challenge in adapting platform to changing requirements over 10-15 year life: stretching chassis, incorporate new powertrain technologies, rigid tooling, too many constraints • O($10B) commitments for design, factory layout, tooling,… • NASA Launch Vehicles [Silver et al. 2005] • NASA Space Shuttle Program [1972-present] • Original traffic model called for ~ 50 flights/year • Actual flight rate much smaller, technical issues, long turnaround times, high fixed cost, ~$4 billion/year Iridium 780 km gasoline hybrid STS
Design for Changeability/Flexibility • Traditional Systems Engineering Methods (QFD, DSM,…) • Hauser, LR.; Clausing, D. The House of Quality. Harvard Business Review,. Vol. 66, No. 3, May-June 1988,. pp, 63-73 • say very little about system change over time • Changeability • E. Fricke and A.P. Schulz, Design for changeability (DfC): Principles to enable changes in systems throughout their entire lifecycle, Systems Engineering, 8(4) (2005) • Fundamental & Supporting Principles for Changeability • Engineering Changes • C. Eckert, P. Clarkson, and W. Zanker, Change and customisation in complex engineering domains, Research in Engineering Design, 15(1) (2004), 1–21 • External vs. Internal Changes, Classification in Multipliers, Absorbers, etc… • Flexibility • J. H. Saleh, D. Newman, D. Hastings. “Flexibility in System Design and Implications for Aerospace Systems” Acta Astronautica, Vol. 53, No. 12, (2003), pp. 927 – 944 • Importance of Design Lifetime • Product/System Platforms • Seepersad, C.C., Mistree, F., and Allen, J.K.. (2002) "A Quantitative Approach for Designing Multiple Product Platforms for an Evolving Portfolio of Products." in Proceedings of the ASME Design Engineering Technical Conferences, Advances in Design Automation, Montreal, Canada, (2002) 90% of research and teaching on system and product design is about “clean sheet” design, but 90% of industrial practice is design-by-redesign
Research Questions • What are sources of changes in system design (during design and/or operations)? • exogenous uncertainties, internal sources of change • How can the amount of change and change propagation paths be • analyzed for existing or past projects? • predicted for future projects? • What causes lock-in and how can it be mitigated? • What are elements of switching costs? • What can be done to affect switching costs? • Where should flexibility be embedded? • How much is it worth? • Is there an optimal degree of flexibility in system design?
Change Propagation Analysis work with Monica Giffin and Gergana Bounova inspired by Clarkson, Eckert and Keller
Complex Sensor System Radar System for BMD, complex hardware, software, human operators Derivative of earlier system 9 Year development 46 Areas Hardware Software Program Documentation System Map (graph) Interconnections between areas System Description
Change Request Database technical, managerial, procedural track parent, child, siblings by areas with unique ID number chronologically numbered IDs Data Mining Procedure Export from DBMS to text file Written into MySQL database with Perl scripts Equivalent to a MS Word document with 120,000 pages Sorting, Filtering, Anonymizing Write simplified change request format (see right side) Data Set Typical Change Request
There is an inverse relationship between expected change magnitude and its frequency of occurrence. Very large changes are rather infrequent while small changes on the other hand are commonplace. Nearly half the small (magnitude 0) changes were either withdrawn, superseded or disapproved (46.6%), whereas nearly all the large changes (magnitude 5) were approved and carried out to completion (96.7%). Initial Analysis
Apply Graph Theory to extract networks of connected changes parent-child changes sibling changes Most changes are only loosely connected 2-10 related changes Some large networks emerged Question: do these networks emerge from a single initial change? Change Networks Legend Change proposed parent child Change rejected sibling sibling Change implemented
Change Propagation Network Network plot of largest change network in the dataset, with 2579 associated change requests. Created by Gergana Bounova Data from Monica Giffin (SDM)
1: Y5 new CRs ID 1-22000 Analysis of 87CR Network 8000 12156 13320
2: Y6 new CRs ID 22000-26000 23942 23945 23992 24980 23729 23922 23024 23821 24781 23925 23831 25481 8000 22850 24659 25053 25476 24927 25515 12156 24926 22946 25463 13320
3: Y7 new CRs ID 26000-29000 27585 28213 28187 28007 28166 28122 28153 27027 28695 28790 28567 28788 23942 28846 27627 28878 23945 28531 26333 28528 27656 28428 28009 26331 23992 28186 27169 24980 23729 28067 27023 23922 23024 28529 28821 23821 24781 23925 28601 28162 28696 23831 25481 8000 22850 24659 25053 25476 27952 24927 25515 12156 24926 22946 25463 27592 26117 13320
4: Y7 new CRs ID 29,000-31,000 27585 30143 28213 28187 28007 30344 28166 28122 28153 27027 28695 28790 28567 28788 29538 30614 29547 23942 29399 28846 27627 30465 28878 23945 28531 26333 30148 28528 27656 28428 28009 26331 29711 23992 28186 27169 24980 23729 28067 27023 23922 30771 23024 28529 28821 30126 23821 30548 29353 29731 29826 29226 30466 30501 24781 29227 23925 30503 28601 28162 29744 28696 23831 25481 8000 22850 24659 25053 25476 27952 24927 25515 12156 24926 22946 25463 27592 26117 13320
5: Y7 new CRs ID 31000-32645 27585 30143 28213 28187 28007 30344 28166 28122 28153 27027 28695 28790 28567 28788 29538 30614 29547 23942 29399 28846 27627 30465 28878 23945 28531 26333 30148 28528 27656 28428 28009 26331 29711 23992 28186 27169 24980 23729 28067 27023 23922 30771 23024 28529 28821 32289 30126 23821 30548 29353 29731 29826 29226 30466 30501 31471 24781 29227 23925 30503 28601 28162 29744 28696 23831 25481 8000 22850 31973 24659 25053 31972 25476 27952 24927 25515 32645 12156 31966 24926 22946 31235 25463 27592 26117 13320 31967
6: Y8/9 update final status of all CRs 27585 30143 28213 28187 28007 30344 28166 28122 28153 27027 28695 28790 28567 28788 29538 30614 29547 23942 29399 28846 27627 30465 28878 23945 28531 26333 30148 28528 27656 28428 28009 26331 29711 23992 28186 27169 24980 23729 28067 27023 23922 30771 23024 28529 28821 32289 30126 23821 30548 29353 29731 29826 29226 30466 30501 31471 24781 29227 23925 30503 28601 28162 29744 28696 23831 25481 8000 22850 31973 24659 25053 31972 25476 27952 24927 25515 32645 12156 31966 24926 22946 31235 25463 27592 26117 13320 31967
Observations • The 87CR network did not initiate with a single CR and then grow gradually by change propagation • Several initially unrelated changes grew together to form a larger network over time • A few changes are highly connected • Examples: 24781(7), 29226 (7), 28009 (7) • highly connected changes are not necessarily parent changes • Most changes only connect to one or two other changes • Clustering • Changes that are disapproved or whose status is open tend to cluster with respect to each other (more analysis required) • The network is loosely connected • Example: Remove 26333 29226 and the network separates Quick Netdraw Demo
Change Propagation Motifs Step j Step i 1-motifs Implemented Change C11 Single Change proposed C00 Single Change proposed C10 Rejected Change 1 motifs Legend Change proposed Change rejected Change implemented 100 Total 87 parent child sibling sibling
Change Propagation Motifs (cont.) parent-child-2-motifs Analysis of 87CR Step k Step j P01 P11 Both Changes Rejected Step i P12 P10 Parent Rejected Child Implemented P21 P20 P00 Parent Implemented Child Rejected P22 P02 Parent-Child Changes Proposed Parent and Child Implemented 9 unique 2P-motifs 8 possible paths
Observations from 2-motifs • Parent-Child Pairs • The most frequent pattern is that both a parent and child change are implemented as planned (58%) • If a change in a change-pair is disapproved it is more likely to be the child (24%) • Sibling Pairs • In sibling pairs it is most likely that both will be implemented (41%) or at least one of them is implemented, while the other one is rejected (28%) • If one change in a pair is disapproved there is a 25% chance that the sibling will be disapproved as well
3-motifs nodal CR connectivity motifs PPS PSP ok ok illegal illegal illegal 3 parent-child links 2 parent-child links, 1 sibling link PSS SSS Illegal links are those where CRs have more than one parent or where there is a cycle ok ok 2 sibling links 3 sibling links For each legal triplet we can define a set of 3-motifs
PSP220=PSP202 step l 3-motifs (cont.) step k PSP222 step j PSP family PSP210=PSP201 PSP200 PSP221=PSP212 PSP022 step i PSP020=PSP002 PSP000 PSP211 PSP021=PSP012 PSP010=PSP001 PSP120=PSP102 PSP121=PSP112 PSP011 PSP100 PSP111 PSP110=PSP101
Only found two 3-motifs from PSP family to ever occur in 87CR data set 3-motif PSP statistics PSP family “change family pattern” PSP222 parent and two related child changes were proposed; all were implemented 7 instances found “change substitution pattern” PSP221=PSP212 parent and two related child changes were proposed; only one child was implemented 4 instances found one interpretation: one child change substitutes for another
Bi-partite graph analysis: Analyze relationship of change request network to underlying system area network Questions: Which areas are most affected by changes? Which areas are unaffected? [constants] Which areas act as change multipliers, carriers, absorbers? Which areas act as reflectors of change? Bi-Partite Graph Analysis
1-motif-area-impact analysis 30143 27585 28213 28187 28007 30344 28166 28122 27027 28153 28695 28567 28788 28790 29538 30614 29547 23942 29399 28846 27627 30465 28878 23945 28531 26333 30148 28528 27656 28428 26331 23992 29711 28009 28186 27169 24980 23729 28067 23922 27023 30771 23024 32289 28821 28529 30126 29826 23821 29226 29353 30548 29731 System Network Map 30466 30501 31471 23925 24781 30503 29227 28601 28162 29744 28696 23831 8000 22850 25481 31973 25053 24659 31972 27952 24927 25476 25515 32645 31966 12156 22946 24926 31235 27592 25463 31967 26117 13320 Change Propagation Network
1-motif-area-impact analysis: Results by Area • Change Activity by area • Areas 3, 19 and 1 are most active in terms of number of proposed CR • Change Acceptance Index (CAI) • fraction of proposed changes that are actually implemented • Change Reflection Index (CRI) • fraction of proposed changes that are rejected
87CR-area classification perfect reflectors Area 5 Reflectors Area 19 Area 3 Area 10 Acceptors Areas 4, 6, 14, 20 Area 11, 23, 35 Area 1 no CRs issued or all CR’s unresolved perfect acceptors
Change Propagation Index (CPI) change propagation probability • Classify each area • Absorber, Carrier, Multiplier total completed changes in Area j instigating area DDSM Change Propagation Frequency receiving area A change in Area 1 caused changes in Area 6 with a frequency of 4.17%. -1 <= CPI <= +1
System Area Classification CPI Spectrum • Areas found to be strong multipliers • 16: hardware performance evaluation • 25: hardware functional evaluation • 5: core data processing logic • 32: system evaluation tools • 19: common software services • 3: graphical user interface (GUI) • Areas found to be perfect reflectors • 27, 41: look like perfect absorbers • but actually zero changes implemented • despite numerous changes proposed • = perfect reflectors Note: results differ when doing 2-motif analysis
CPM Tool • Developed at EDC, University of Cambridge, UK Likelihood of changes propagating from area 1 to other areas
Discovered new change pattern: “inverted ripple” system integration and test bug fixes [Eckert, Clarkson 2004] subsystem design major milestones or management changes component design Change Request Generation Change Requests Written per Month 1500 Source: Monica Giffin (SDM) 1200 900 Number Written 600 300 0 1 5 9 77 81 85 89 93 73 13 17 21 25 29 33 37 41 45 49 53 57 61 65 69 Month
Step 1 Step 2 Time-Expanded Decision Networks • We developed concept of time expanded decision networks, to formalize effect of lock-in and identify opportunities for flexibility 1.) Design Set of feasible System Configurations 2.) Quantify Switching Costs and Create a Static Network 3.) Create a Time Expanded Network based on the Static Network 4.) Create Operational Scenarios, Evaluate Optimal Paths 5) Modify System Configurations to exploit easier Switching exit with optimal initial configuration and switching embedded Silver M.R., de Weck O.R., “Time Expanded Decision Networks: A Framework for Designing Evolvable Complex Systems , Systems Engineering, (10) 2, 2007
Design and Ops Costs Switching Costs Time-expanded Decision Networks (TDN) • Expand static network in time • Model operations arcs and switching arcs • Chance Nodes and Decision Nodes • Cost Elements identified Step 3
Step 5 • Evaluate optimal paths through TDN: • acyclic network • topological ordering • reaching algorithm (find shortest path) Method Scaling # of nodes # of paths optimal path solvable in # of arcs Scenarios and Path Optimization Step 4 Major advantage over traditional decision trees !
Model Development Application of TDN to Launch Vehicles • How to choose launch vehicle configurations for space exploration when future traffic model is uncertain • Demand at the campaign level vehicle demand • Effort started under NASA funded Draper/MIT CER effort 2004-2005, continued development after that 4 initial configurations considered
SDV-A (80 mt) EELV+ (62 mt) TDN Launch Case Study - Results • Initially: only two launch vehicles are ever used • 1:SDV-A(80mt) = large, 2:EELV+(62 mt)=small • No switching during lifecycle observed (= “lock-in”) • Idea: gradually reduce switching cost to: • see if/when switching will occur • what switches are selected most often? • how valuable is it? Switching cost matrix
As switching cost is reduced switching becomes more frequent Scenario 8 most interesting Max savings $0.6B/$2.8B Guideline for embedding flexibility in 3:EELV+ and how much it is worth TDN Launch Case Study – Results (cont.) reduce switching cost
“Lock-in” Quadrant volatile inflexible volatile flexible facilitate switching embed flexibility avoid switching design robustly stable inflexible System Landscape Degree of Outcome Uncertainty sNPV communication satellites E[NPV] commercial aircraft wireless sensor networks automotive platforms stable flexible water supply systems (some) consumer products highway infrastructure Relative Switching Costs DC/LCC
Emerging Principles • Flexibility is a relative, not absolute system property. • There are two types of flexibility: operational (inner loop), configurational (outer loop). • Flexibility only makes sense in the context of specified uncertainty, which might lead to specific classes of changes in the future. General flexibility does not exist. • Fully reconfigurable systems are those systems that exhibit the highest degree of flexibility where the switching costs between a finite set of configurations (states) has been reduced to nearly zero. • Given an uncertain future operating environment, there exists an optimal degree of flexibility that will balance reduction in switching costs with upfront system design/build complexity and ops cost. • Real options are switching cost reducers.
Future Work • Uncertainty Characterization (jump-diffusion = continuous change + discrete events superimposed) • Change propagation in complex systems • refine CPI • sibling changes: count them or not? • change propagation frequency versus motif-counts • how to best use change magnitude • compare predicted versus actual change propagation and effort • Empirical/Field work on system evolution over time • Example Whitney subway study • Real Options Equivalence of TDN